The world’s energy watchdog, the International Energy Agency, recorded a 6% surge (over 1,500 terawatt-hours) in global electricity demand last year – the largest in history. With Russia’s invasion of Ukraine adding to the turmoil, the resultant price hikes and looming threats of shortages have thrown the energy system into its most turbulent period since the oil crisis of the 1970s.
Whilst globally, governments and businesses are already committed to steep decarbonisation targets, reducing power consumption is also increasingly a critical factor in achieving business-wide cost-saving. By efficiently capturing, aggregating and analysing your facility’s power data, you can get a clearer picture of energy as a raw material cost, helping to secure total buy-in from associates and conquer Net-Zero scepticism for your bottom line.
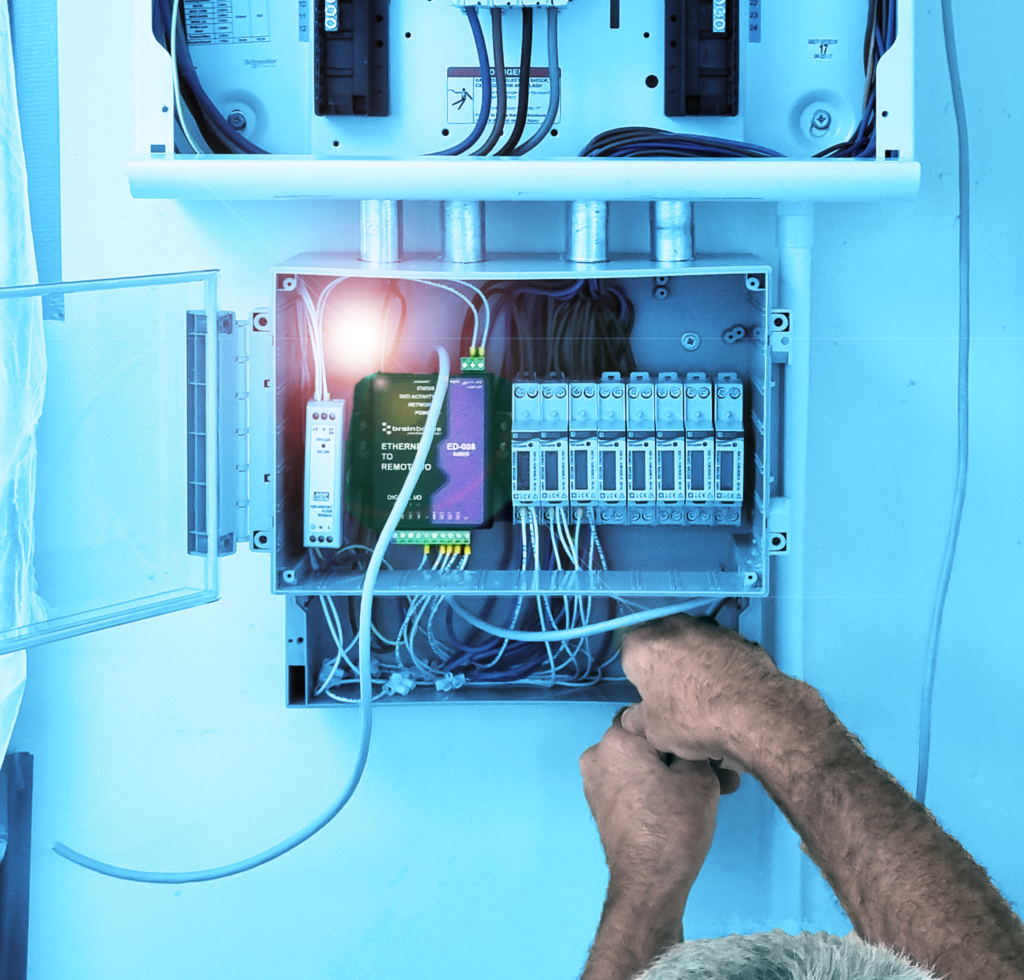
The first step in understanding energy costs is to monitor power consumption, simply achieved by retrofitting energy monitoring devices into the existing production environment. Having provided the components and schematic diagram to a qualified electrician, electrical sub meters were installed onto Brainboxes in-house production line within half a day.
 Distribution boards take electricity from the main supply to distribute safely to circuits throughout your facility. Installing sub-meters at these electrical distribution boxes allows the monitoring of electrical signals – every time a kWh of usage is recorded, the tally count on the sub meter increases. Adding a Brainboxes BB-400 Industrial Edge Controller to the distribution panel allows you to not only monitor the power consumption of individual areas, machines and processes, but also capture timestamps and record historical usage data. As each unit of energy is added to the sub meters’ tally, an electrical signal is sent to the BB-400 via its IO lines, which it then converts into digital data.
The actionable insights are already there, contained in the data which the smart controller stores in a database using free to start, open-source software such as InfluxDB. Complex statistical analysis isn’t required as all the detailed information on units of power consumed, cost (both per kWh and total) and carbon footprint is clearly presented on a centralised Energy Monitoring visual dashboard using another open-source platform: Grafana.
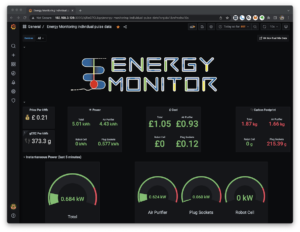 Visualising data at any given time, and comparing it to historical performance data, makes it easier to see where resources are being spent. Proactively monitoring energy usage allows you to identify potential flaws and enhance Enterprise Resource Planning (ERP) – some of the largest quality gains and cost-saving measures can be made by simple changes that are highlighted by the data.
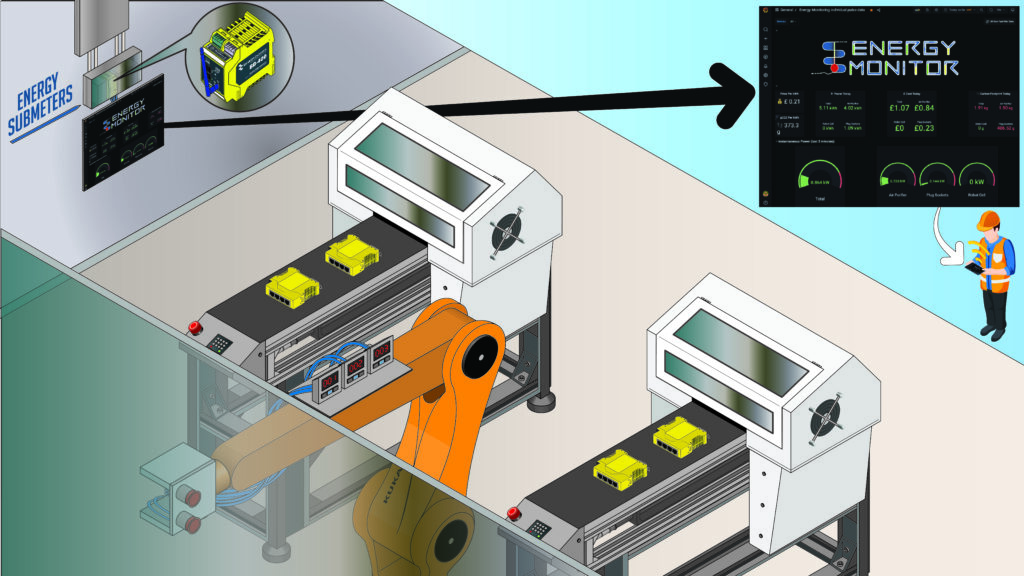
By installing remote IO devices such as Brainboxes ED-008 or ED-516 to monitor additional sub meters, data on every area of your facility, every breaker in your distribution panel, and every single kWh of energy usage can be linked and sent over the network to the BB-400 Edge Controller.
This plant wide energy monitoring data is then aggregated by the BB-400, and can be sent into the cloud or integrated into your existing factory monitoring system, whilst customising the dashboard for your specific needs, decarbonisation goals, and cost-saving targets allows even deeper, individualised analysis.
As ESG environmental regulations evolve, reducing carbon emissions and accelerating sustainability drives are not only vital on the path to Net Zero, but also offer invaluable opportunities to increase brand equity. By simply capturing and analysing accurate energy data using Brainboxes hardware and open-source software tools, you can start delivering the intelligent actions needed to increase positive brand perception, reduce the impact of market volatility on your production costs and achieve substantial financial savings.