FAQs
| Downloads |
|---|
| Node-Red-Energy-Monitor-Flow-Apr23.zip |
| Grafana-Energy-Monitor-Dashboard-Apr23.zip |
Around the world, the cost of electricity is rising. In 2021, electricity saw the highest level of power consumption and the biggest world-wide price rise in 50 years. Increasingly the cost of power used in the manufacture of goods is being treated as a raw material cost. Reducing power consumption is becoming a critical factor in business wide cost saving and also reducing the carbon footprint of the company.
The first step in understanding energy costs in a production environment is to monitor power consumption. In this FAQ, we’ll show you how to simply retrofit energy monitoring devices (electrical sub meters) into your production environment, then capture, aggregate and analyse that data using Brainboxes hardware and open source software tools.
The dashboard and data collected can be made available across the company network or the internet. This FAQ should give you a starter kit to enable plant wide energy monitoring and allow further analysis by customising the dashboard for your needs or integrating the data into your systems.
Warning
Some of the steps included in this FAQ will require a qualified electrician for installation. The installation shown in the image above was installed onsite for the Brainboxes’ production line by a qualified electrician within half a day.
Hardware Requirements
| Brainboxes BB-400 |
This is for data collection, storage and analysis |
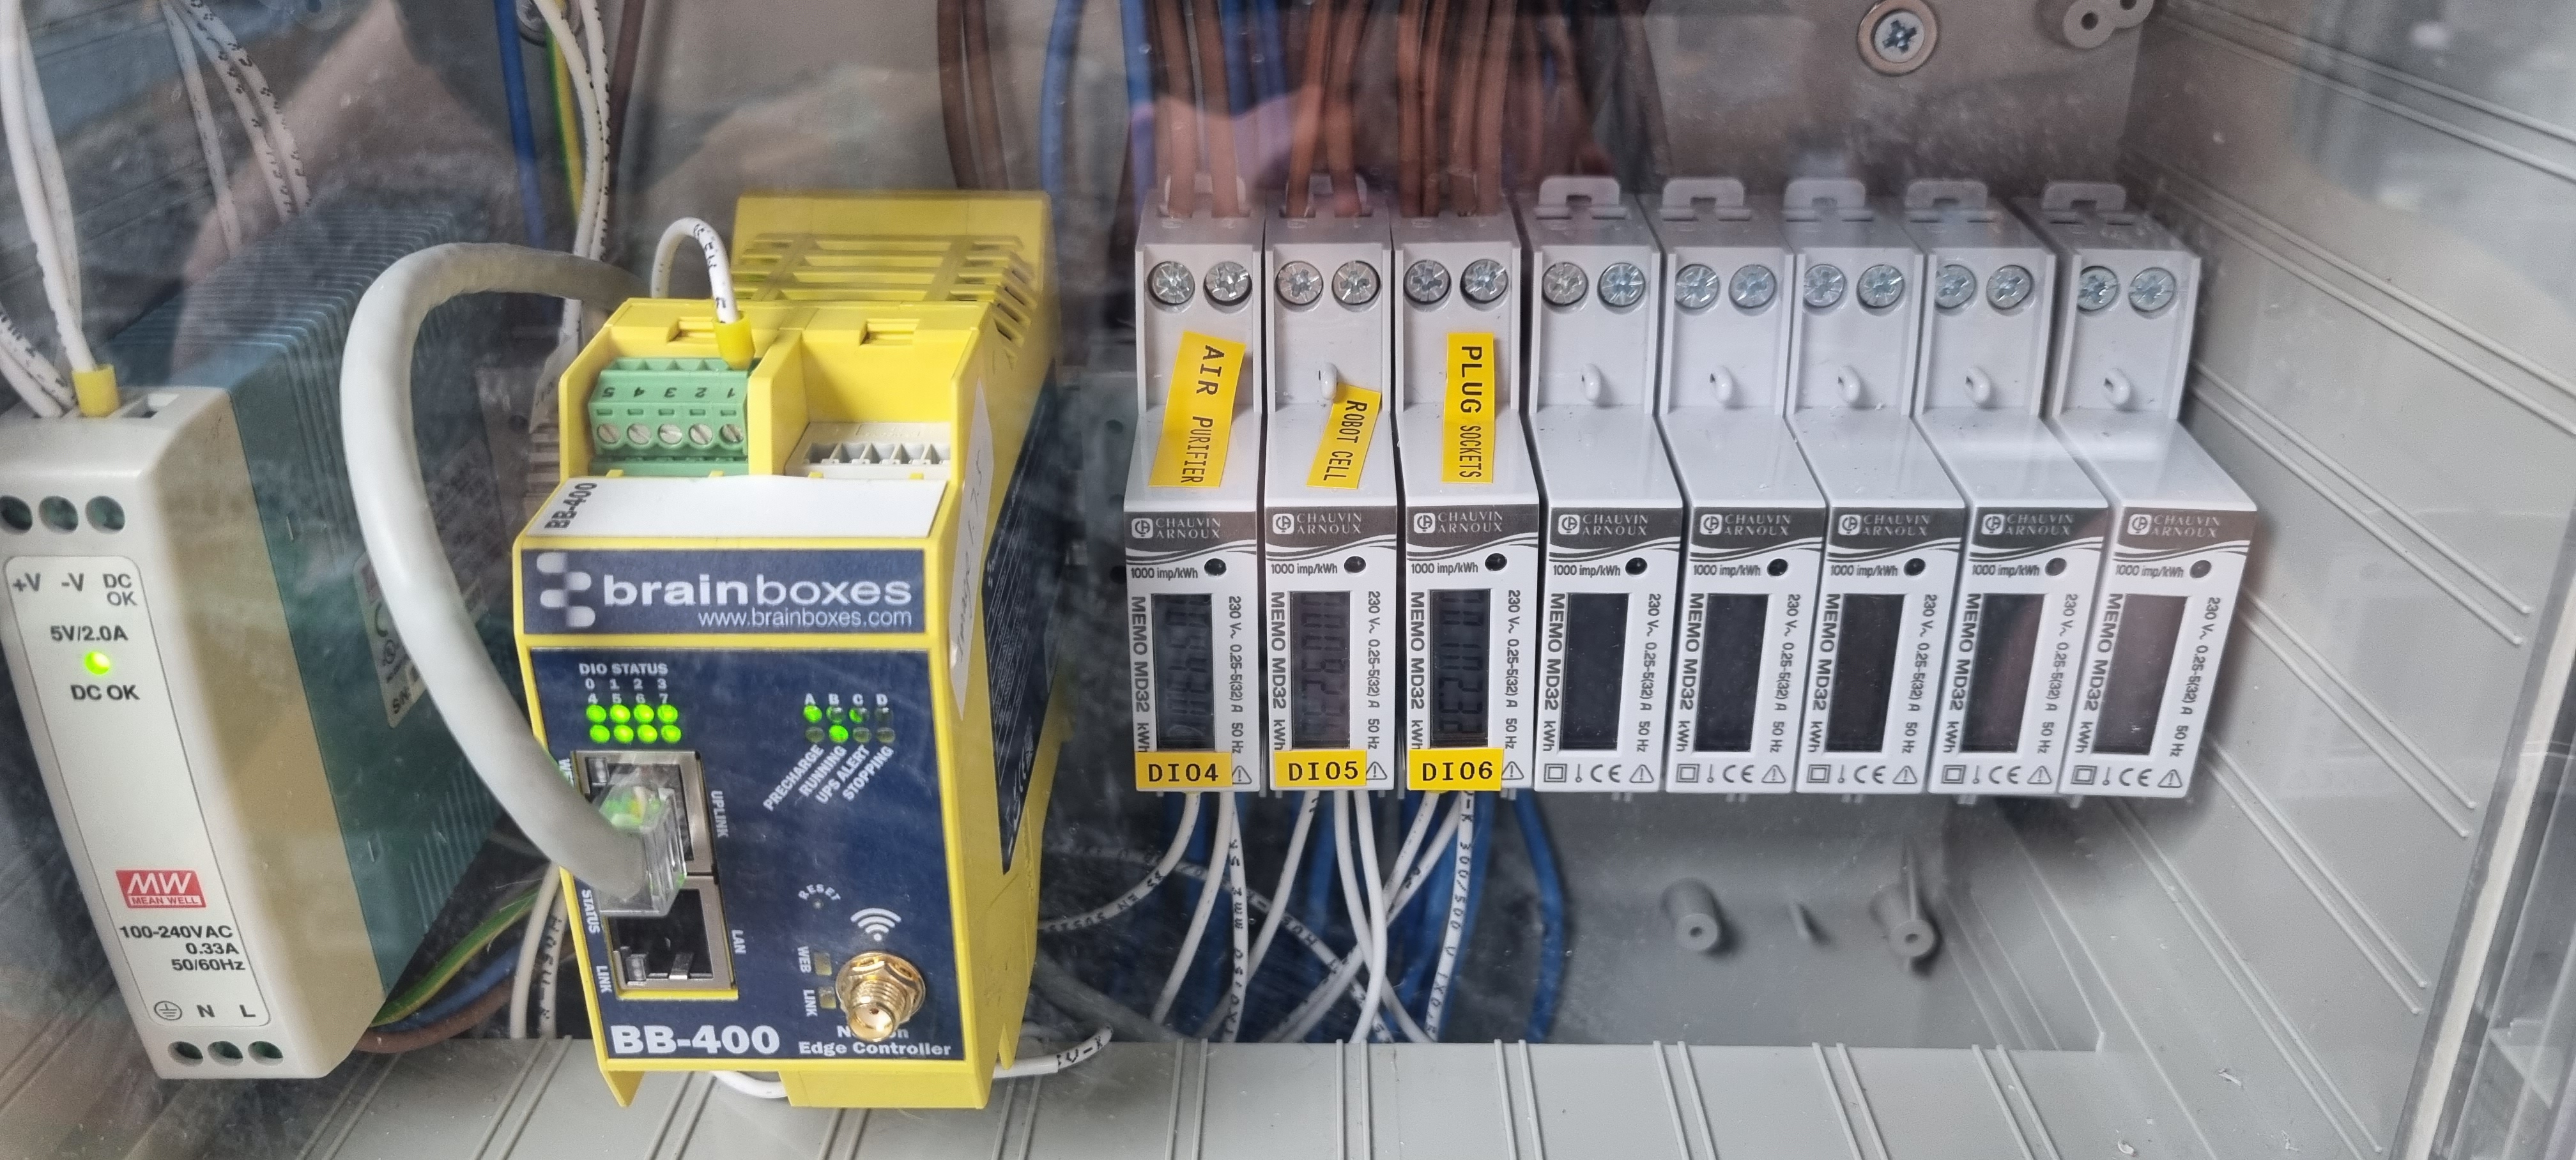
| Electrical Sub Meter | One sub meter is required for each power line to be monitored. This could be single or 3-phase.
In this example, we’re using sub meters from the Chauvin Arnoux Memo Range, but any sub meter with a pulse output or a Modbus (RTU or TCP) output will work. In particular, we’re using the MD32 for single-phase power monitoring. This is suitable for any single phase power line with up to 32A of current draw. |
| ED-008 or ED-516 |
Optional: Additional sub meters can be monitored using a Brainboxes ED-008 or ED-516, linked over the network to a BB-400. |
| 10K Ohm Resistor | One 10K resistor will be required for each sub meter pulse output. |
| DIN Rail Power Supply | This is used for powering the Brainboxes products.
In this example, we’re using the Meanwell MDR-10-5, but any power supply that converts from VAC mains power to +5 to +30VDC will be suitable. |
| Wall-Mounted Enclosure | This will house the Brainboxes products, DIN rail power supply and sub meters.
In this example, we’re using a CamdenBoss 7710 Series CHD771005, which has a transparent Perspex front panel. It also has an internal DIN rail, suitable knockouts for routing mains power cables and sufficient space for 8 sub meters. |
| Mains Power Cabling | 240/110VAC (Live, Neutral & Ground – typically provided by a qualified electrician) for the high voltage side. |
| VDC Power Cabling | Signal and power cabling & crimps used for the low voltage side. |
Schematic Diagram
Note: The pulse outputs of the sub meters each require a 10K Ohm resistor
‘…’ near to Breakers, Output Circuits and Sub Meters implies scalability can easily be achieved

Electrical Installation
Having provided the components and schematic diagram to a qualified electrician, they will then retrofit the wall mount enclosure near the distribution box, routing the power cabling from the distribution box through the added enclosure, into the sub meters and back to the distribution box:
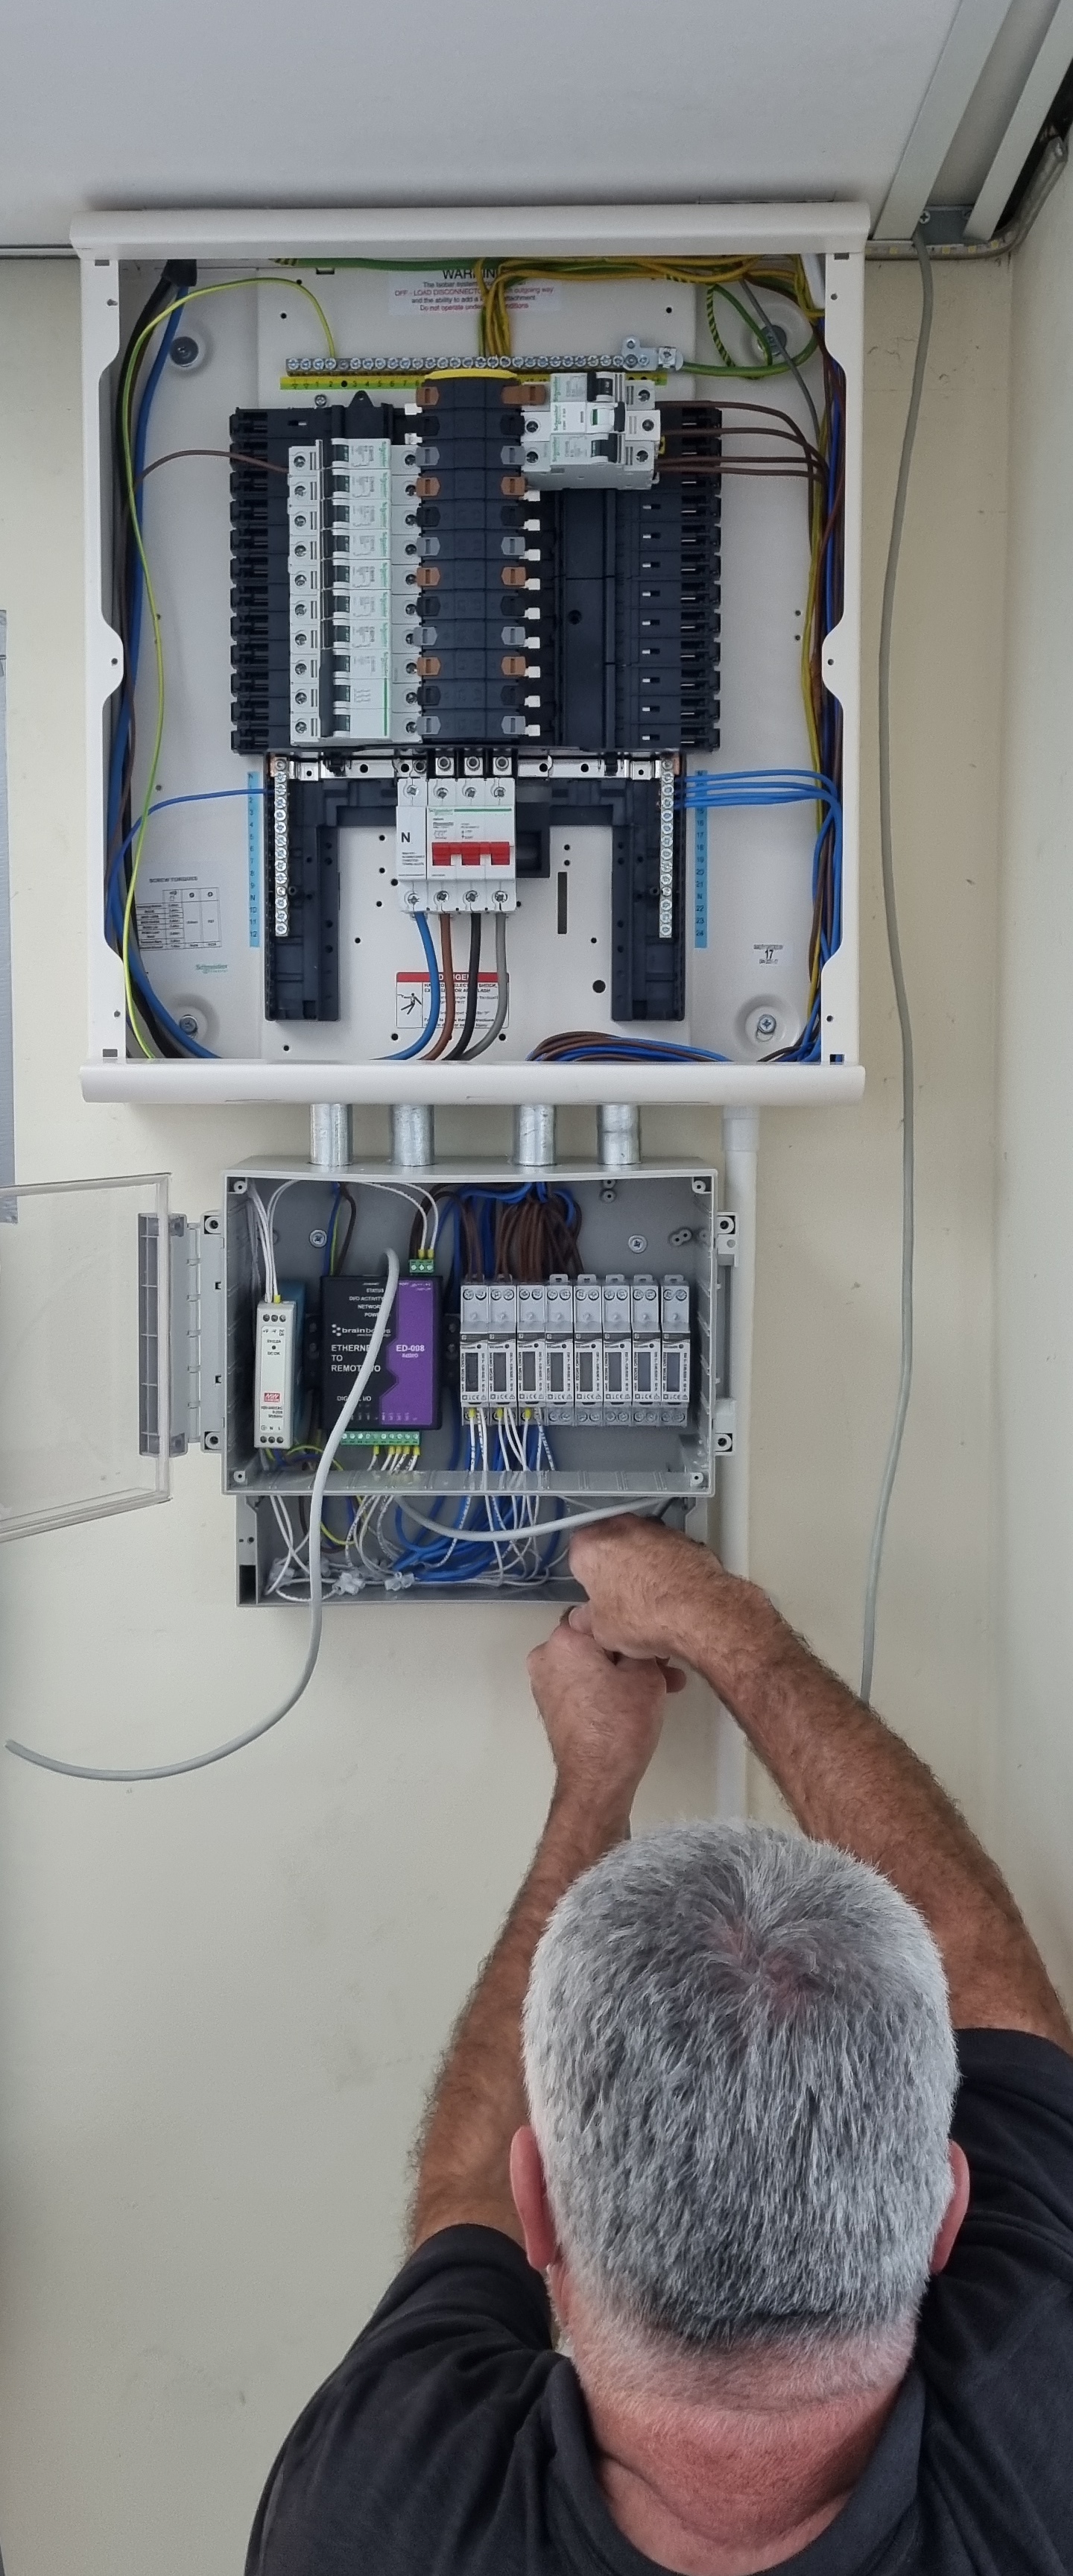
The sub meters and Brainboxes devices should be located in a separate enclosure to the power distribution box for electrical safety reasons.
Software Installation
The software configuration involves: Node-Red, InfluxDB & Grafana installed directly on a Brainboxes BB-400. These are all open-source software applications.
This FAQ will utilise a Brainboxes BB-400 Industrial Controller to not only host Node-Red, InfluxDB & Grafana directly, but also provide digital I/O functionality required for the sub meters.
Alternatively, if a PC or Industrial Controller are already in place on the network, the above software applications can be run here, with a Brainboxes I/O module (ED-008 or ED-516) being installed to provide the required I/O functionality to the sub meters.
| Node-Red is used to capture pulse counts on the BB-400’s IO lines (connected to each of the sub meters) |
| InfluxDB is used to store timestamped data of when the pulses occurred |
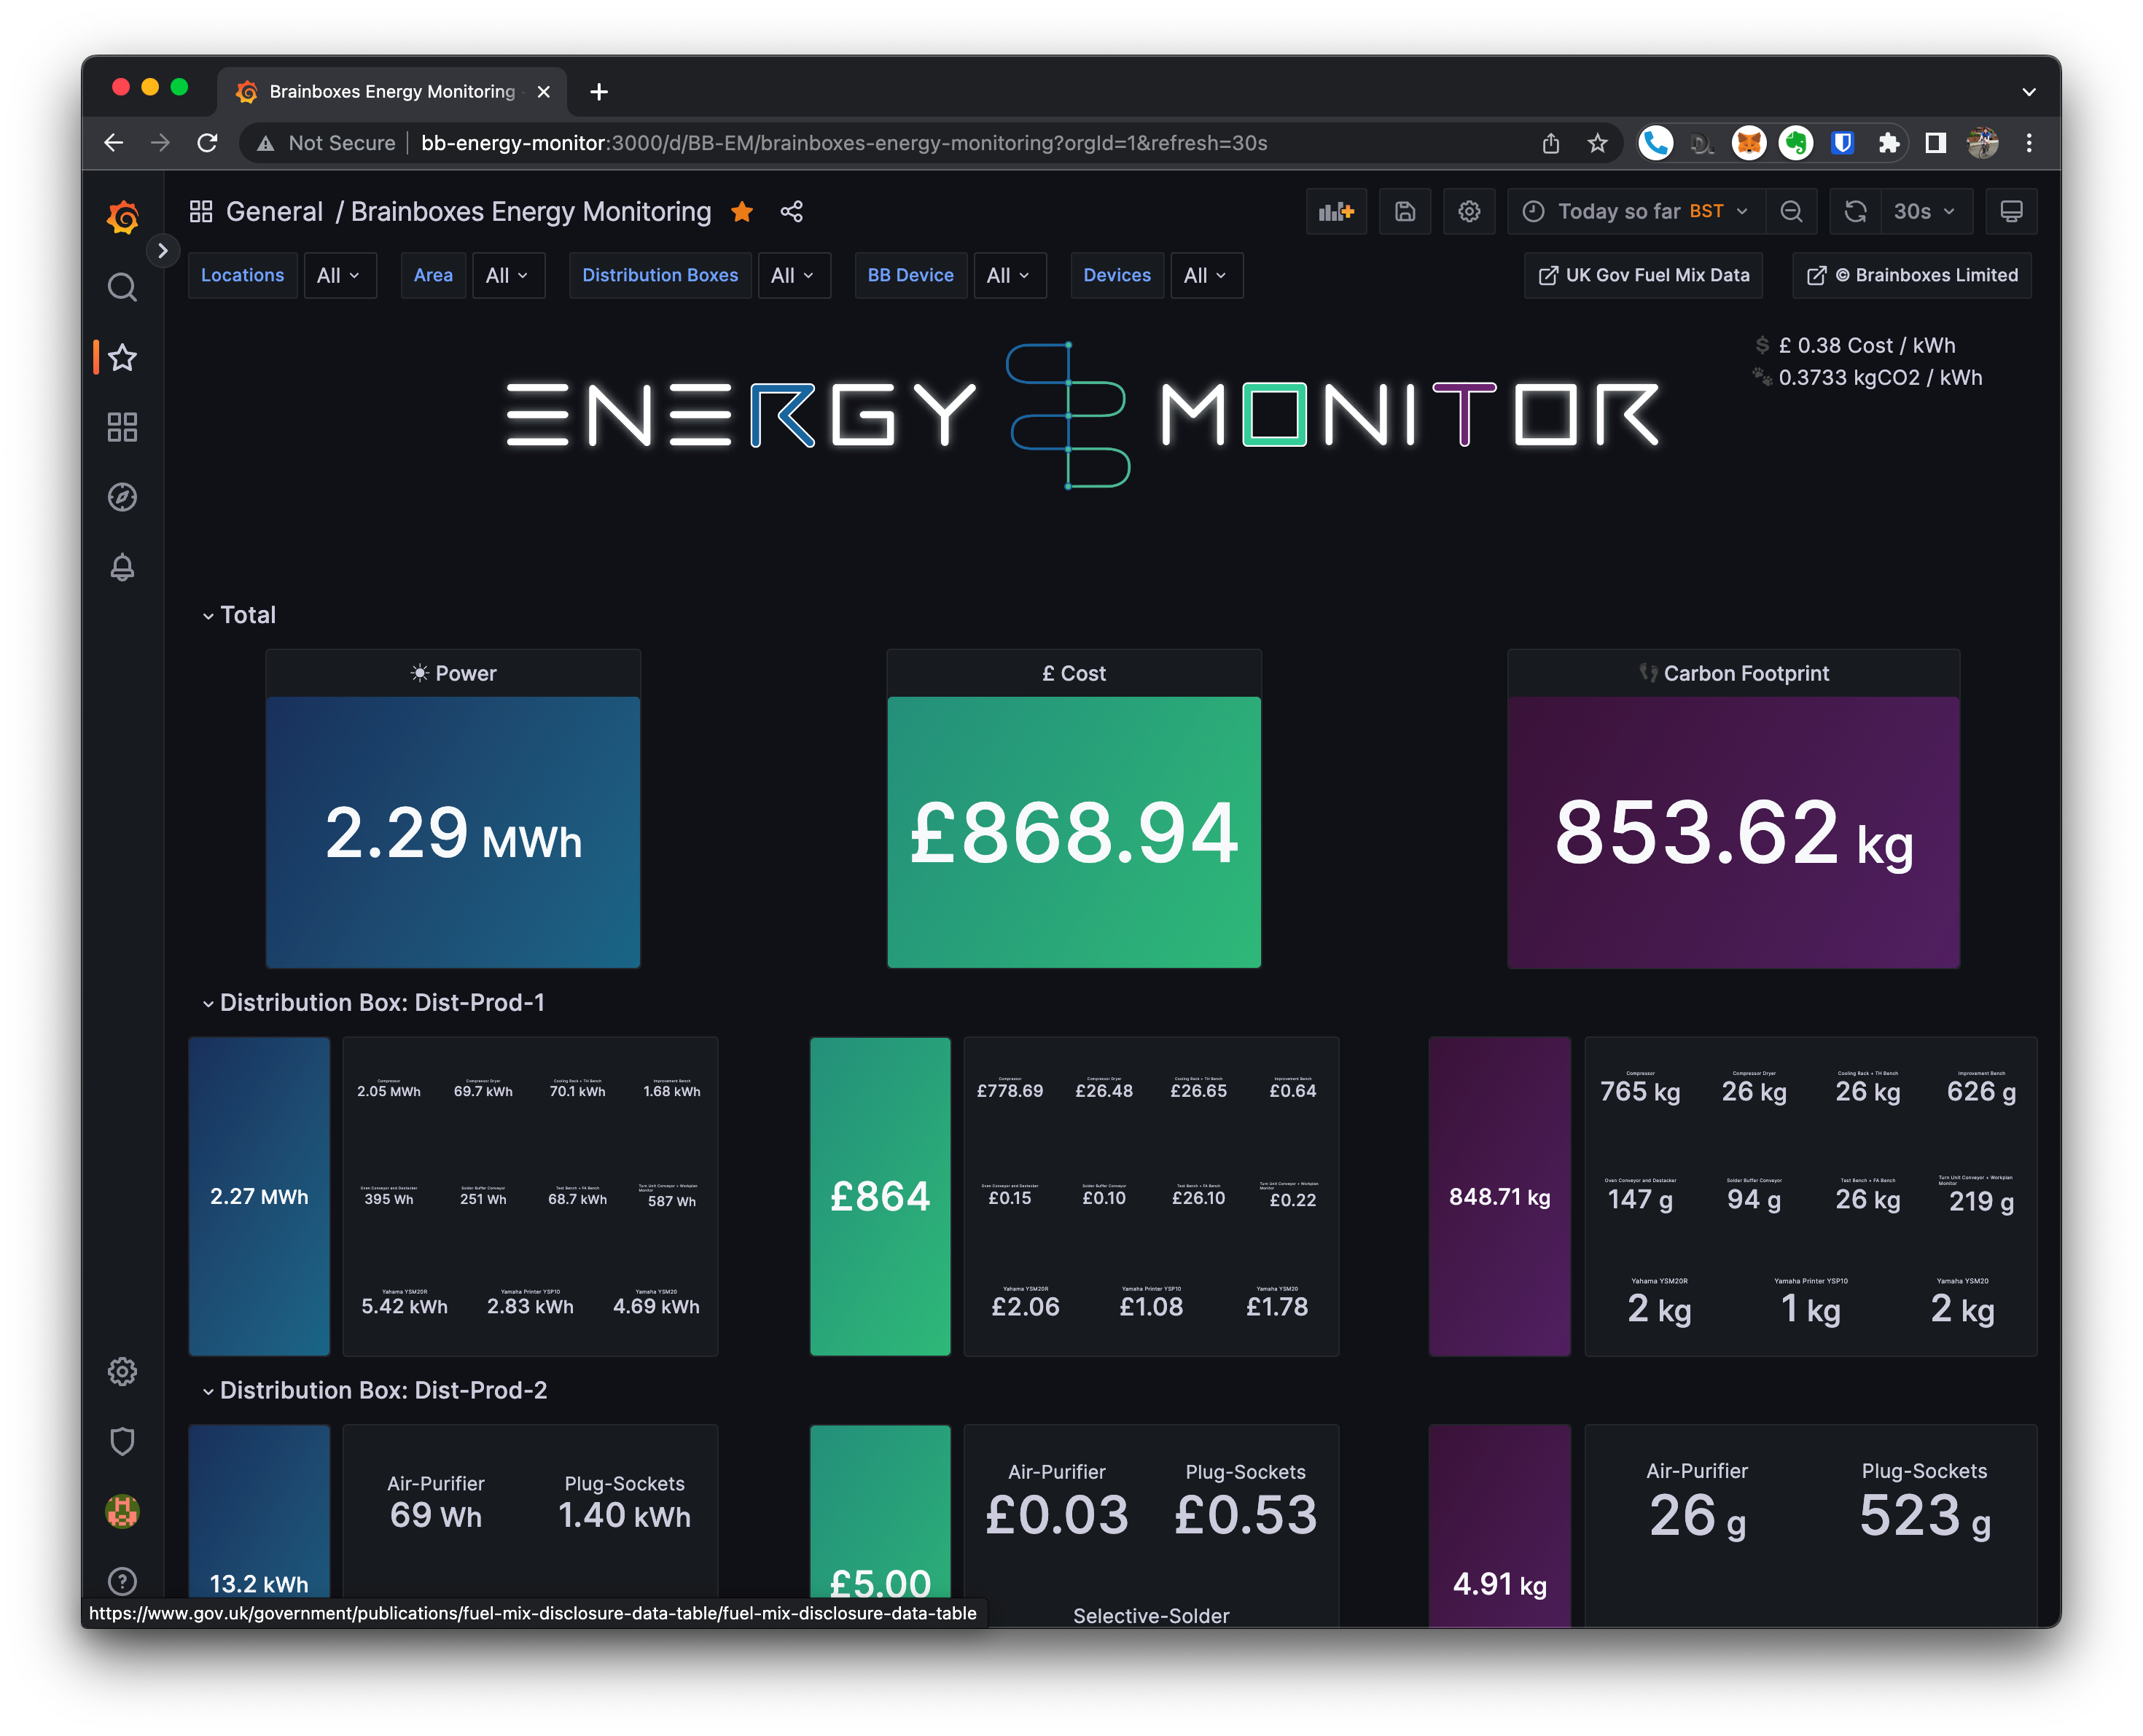
| Grafana is used to visualise the captured data in a dashboard, showing: Energy Consumption, Cost and Carbon Foot-Print |
Node-Red comes preinstalled on your BB-400. Please see the following FAQ on Installing InfluxDB and Grafana. To summarise the FAQ, this can be done by running the following command from your BB-400’s command line:
curl -s http://www.brainboxes.com/files/pages/support/faqs/sample_code/install-grafana-influxdb | sudo bash Now we can configure each application. Please ensure that the software installed on your BB-400 is fully updated before continuing:
sudo apt update && sudo apt -y full-upgrade Node-Red Configuration
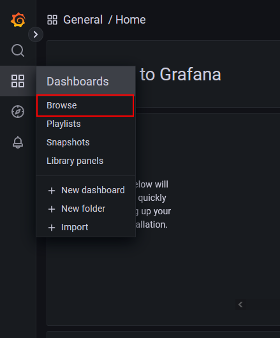
Open Node-Red and install the InfluxDB node by going to: Options > Manage Palette > Install > Search for ‘node-red-contrib-influxdb‘. Import the ‘node-red-energy-monitor-flow.json‘ available from the downloads above, using the Import > Clipboard button.
This will periodically capture the counts on the IO lines of the BB-400 and send the data to InfluxDB for storage. When the flow is first imported, you will need to add an InfluxDB connection. Use the defaults but change ‘database‘ to ‘energy_monitor‘ for the Database name, then deploy the flow:
InfluxDB Configuration
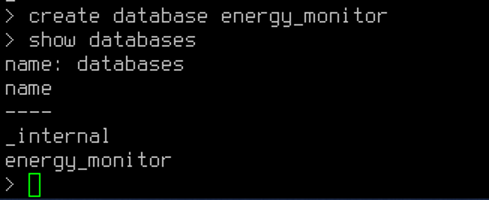
In InfluxDB, we will configure a database and measurement schema. Either using SSH or the web-terminal for your BB-400, run influx, then create database energy_monitor. Verify the database was created with show databases:
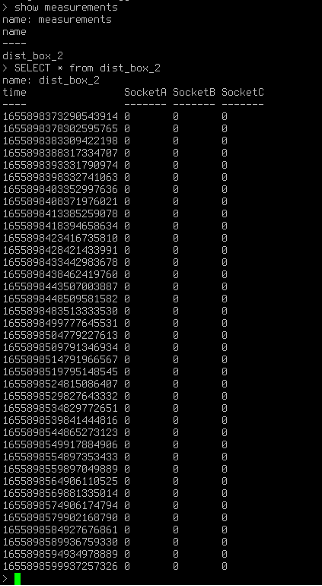
Run show measurements and ‘SELECT * from dist_box_2‘ to verify that the readings are there:
Grafana Configuration
Grafana will need to be setup. Go to ‘http://[device-ip]:3000‘ in your web browser. The default username and password will be ‘admin‘. Create a new password or skip this step.
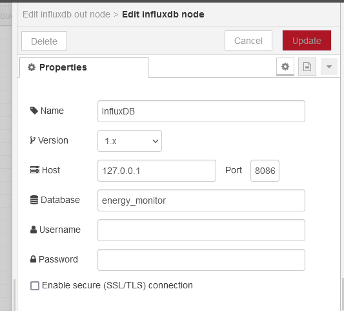
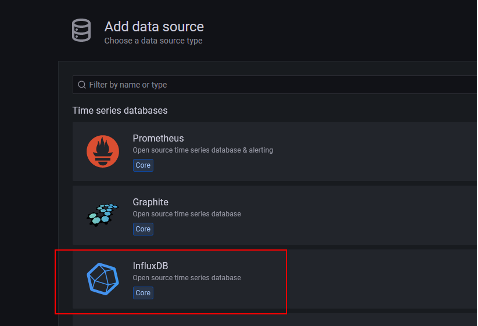
First, we need to make a new Data Source to import our InfluxDB data. Go to the ‘Settings‘ cog on the left bar and click ‘Data Sources‘. Add a data source of InfluxDB:
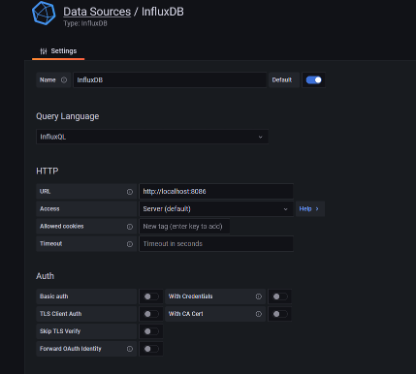
The only fields which need changing in this menu are the URL, which you should set to ‘http://localhost:8086‘ and the Database which you should change to ‘energy_monitor‘. Click Save & Test. This should return ‘Success‘.
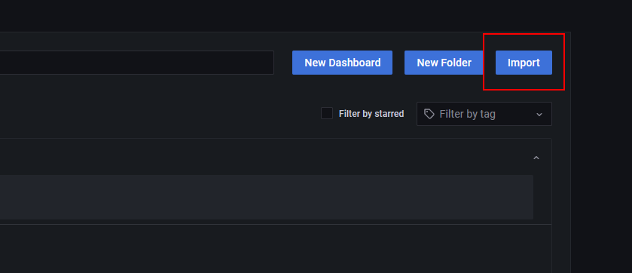
Create a new dashboard and import the dashboard JSON code ‘grafana-energy-monitor-dashboard.json‘, available from the downloads above:
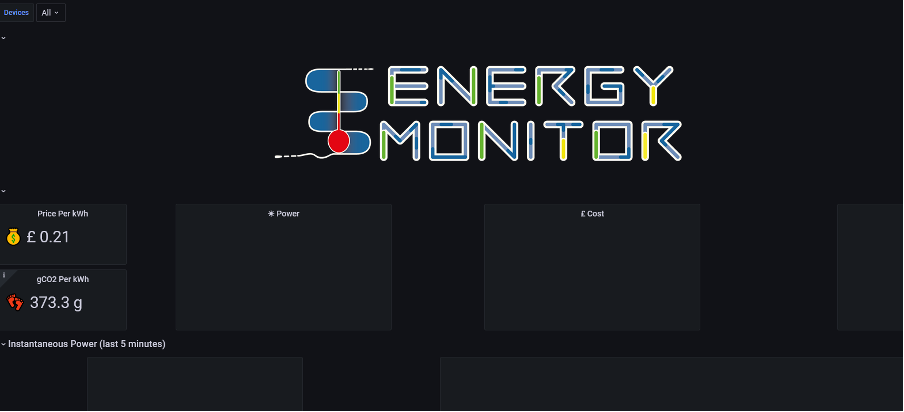
This code should hopefully parse and you should be able to import it. You may see that the dashboard is empty when imported:
If this is the case, disable then re-enable each query, like so:
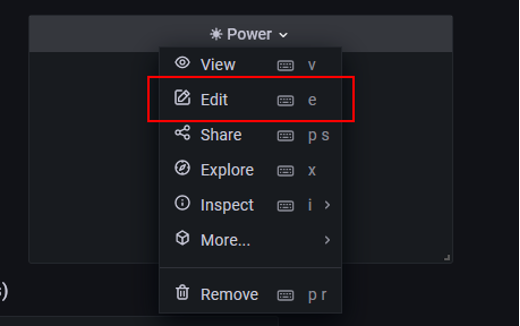
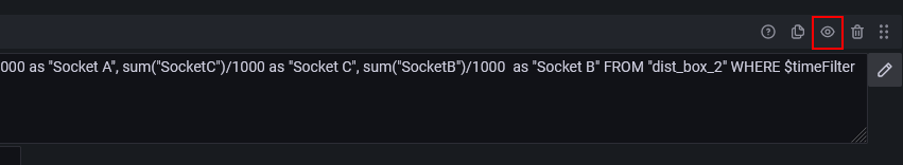
Press the highlighted button in the image above twice. Save and apply the panel in the top right corner of the screen.
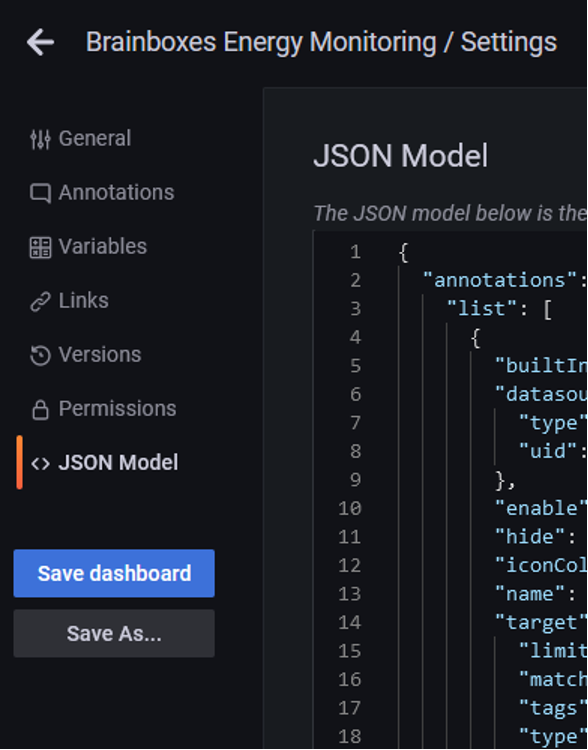
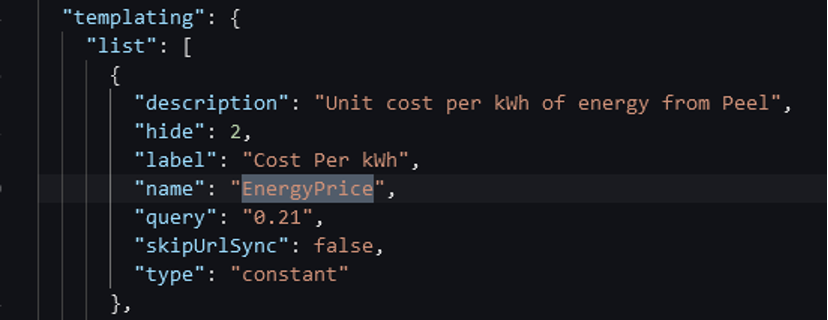
Details like the ‘Price per kWh‘ may need updating. This can be done by editing the dashboard JSON file and replacing the ‘query‘ value for ‘EnergyPrice‘. Click the settings icon in the top right and click ‘JSON model‘. Search for ‘EnergyPrice‘ and edit as necessary:
Other small changes like the currency or timezone will be needed depending on where the monitor will be installed. These can be set by editing the panels and via an option at the top of each panel respectively.
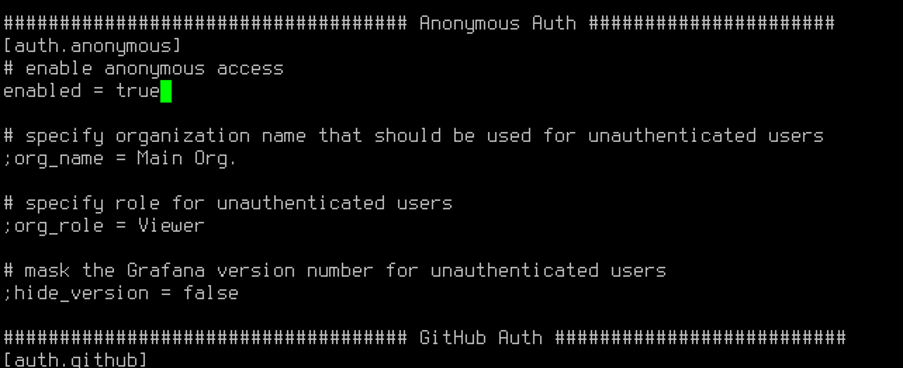
Finally, allow for anonymous viewing of Grafana. This can be done by editing the file /etc/grafana/grafana/ini and setting [auth.anonymous].enabled to true, like so:
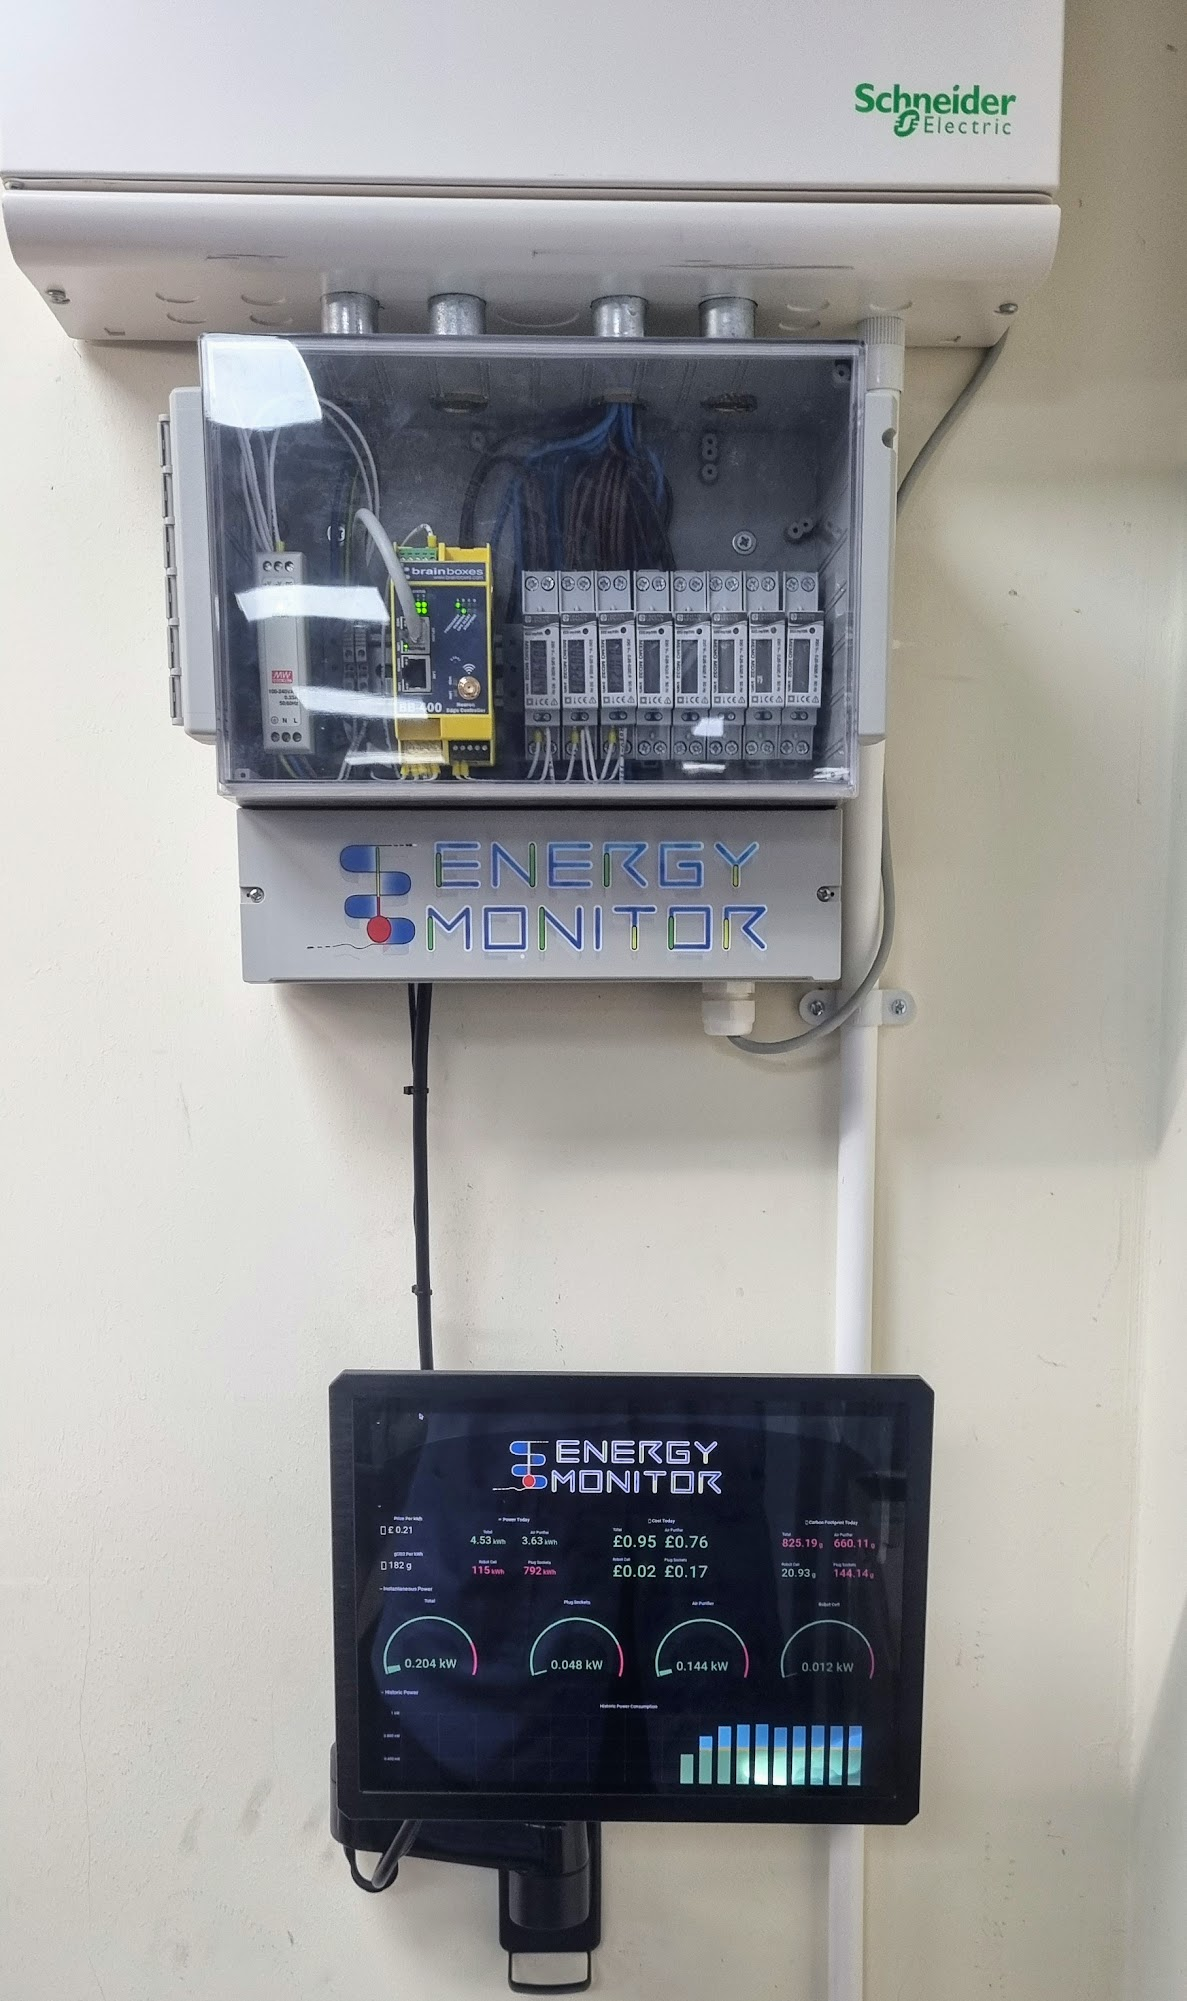
Conclusion: Monitor Power Consumption
You now have an Energy Monitoring Dashboard installed to monitor various sections of your factory, each linked to an individual sub meter and breaker in your distribution panel.
This simple setup can be expanded to incorporate more distribution panels and ultimately could incorporate all areas of the factory. In addition, the data captured can be sent from the BB-400 into the cloud, or a 3rd party factory monitoring system.
If you have any further questions, please contact: [email protected]
Related FAQs
Related Products
FAQs