We sent 10 million commands to a Brainboxes ED-588 and measured every single response. The median round-trip time? Under half a millisecond.
But the average only tells part of the story. Here’s what we learned about latency, why it matters for industrial IO, and why you should stop trusting averages.
Latency is Like a Bus Journey
Think of every IO request as a bus trip. Your total journey time is made up of waiting for the bus and travelling on the bus. A fast bus means nothing if you were stuck at the stop for half an hour. When your application sends a command to a Brainboxes device, the “journey” passes through your software stack, across the network, into the device firmware, down to the IO hardware, and all the way back again. Just like a real bus journey, many things can slow it down:
| Bus Journey | System Equivalent |
|---|---|
| Traffic lights and junctions | Network switches and routers — each hop adds processing time |
| Road works | Network congestion, packet retransmissions, or TCP retries |
| Driver’s familiarity with the route | Firmware optimisation and protocol efficiency on the device |
| Bus engine maintenance | Hardware condition — NIC performance, cable quality |
| Time of day and busyness of roads | Network load — other devices competing for bandwidth |
| Weather | Electromagnetic interference, environmental conditions affecting signal quality |
On a good day with clear roads, the bus arrives quickly and predictably. The same applies to network latency.
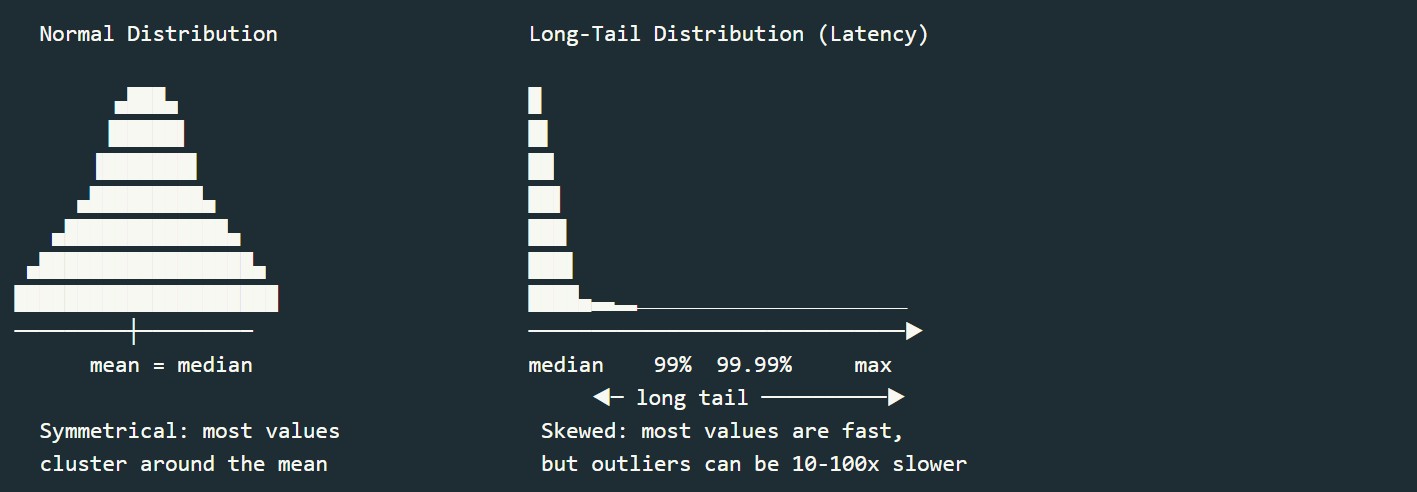
Tail Latency Is the Real Risk
Most people assume that if the average response time is 0.5 ms, almost all responses will be close to 0.5 ms. However, latency doesn’t follow a nice, symmetrical bell curve. Instead, latency has a long tail. The vast majority of responses are fast and tightly clustered, but a small number of outliers are dramatically slower: 10x, 50x, even 100x the median. Those rare outliers are exactly what your users experience.
10 Friends, 10 Buses, 1 Coffee Shop
Imagine 10 friends agree to meet for coffee at 10am. Each takes a different bus, planning to arrive on time based on the typical journey. If each friend has a 95% chance of being on time, the probability that all 10 make it is: 0.95^10 = 59.9%
Nearly half the time, someone’s late. With a more realistic 90% on-time rate per person?
0.90^10 = 34.9%
Two times out of three, the group is waiting for someone. Now scale that up: an industrial control system making 100,000 IO requests per day. Even at 99.99% reliability, you’re virtually guaranteed to hit multiple slow requests every single day. The system doesn’t experience the median. It experiences the tail.
10 Million Requests Later
We connected a PC directly to a Brainboxes ED-588 with a single Ethernet cable and fired 10 million digital IO commands using the Brainboxes.IO .NET API. Every response was recorded into an HDR Histogram: a data structure that preserves detail at every percentile, from the median all the way out to the 99.9999th.
| Concurrent Connections | Mean (ms) | 99th %ile (ms) | 99.99th %ile (ms) | Max (ms) | Total Requests |
|---|---|---|---|---|---|
| 1 | 0.496 | ~0.588 | ~0.866 | 35.123 | 10,000,000 |
| 2 | 0.642 | ~0.805 | ~10.758 | 11.053 | 100,000 |
| 4 | 1.292 | ~1.487 | ~25.843 | 41.677 | 100,000 |
| 8 | 2.487 | ~24.307 | ~79.360 | 99.277 | 100,000 |
99 out of 100 requests complete within 19% of the median.
At four nines (99.99%), the response is still under 1 ms. That level of consistency across 10 million operations is exceptional.
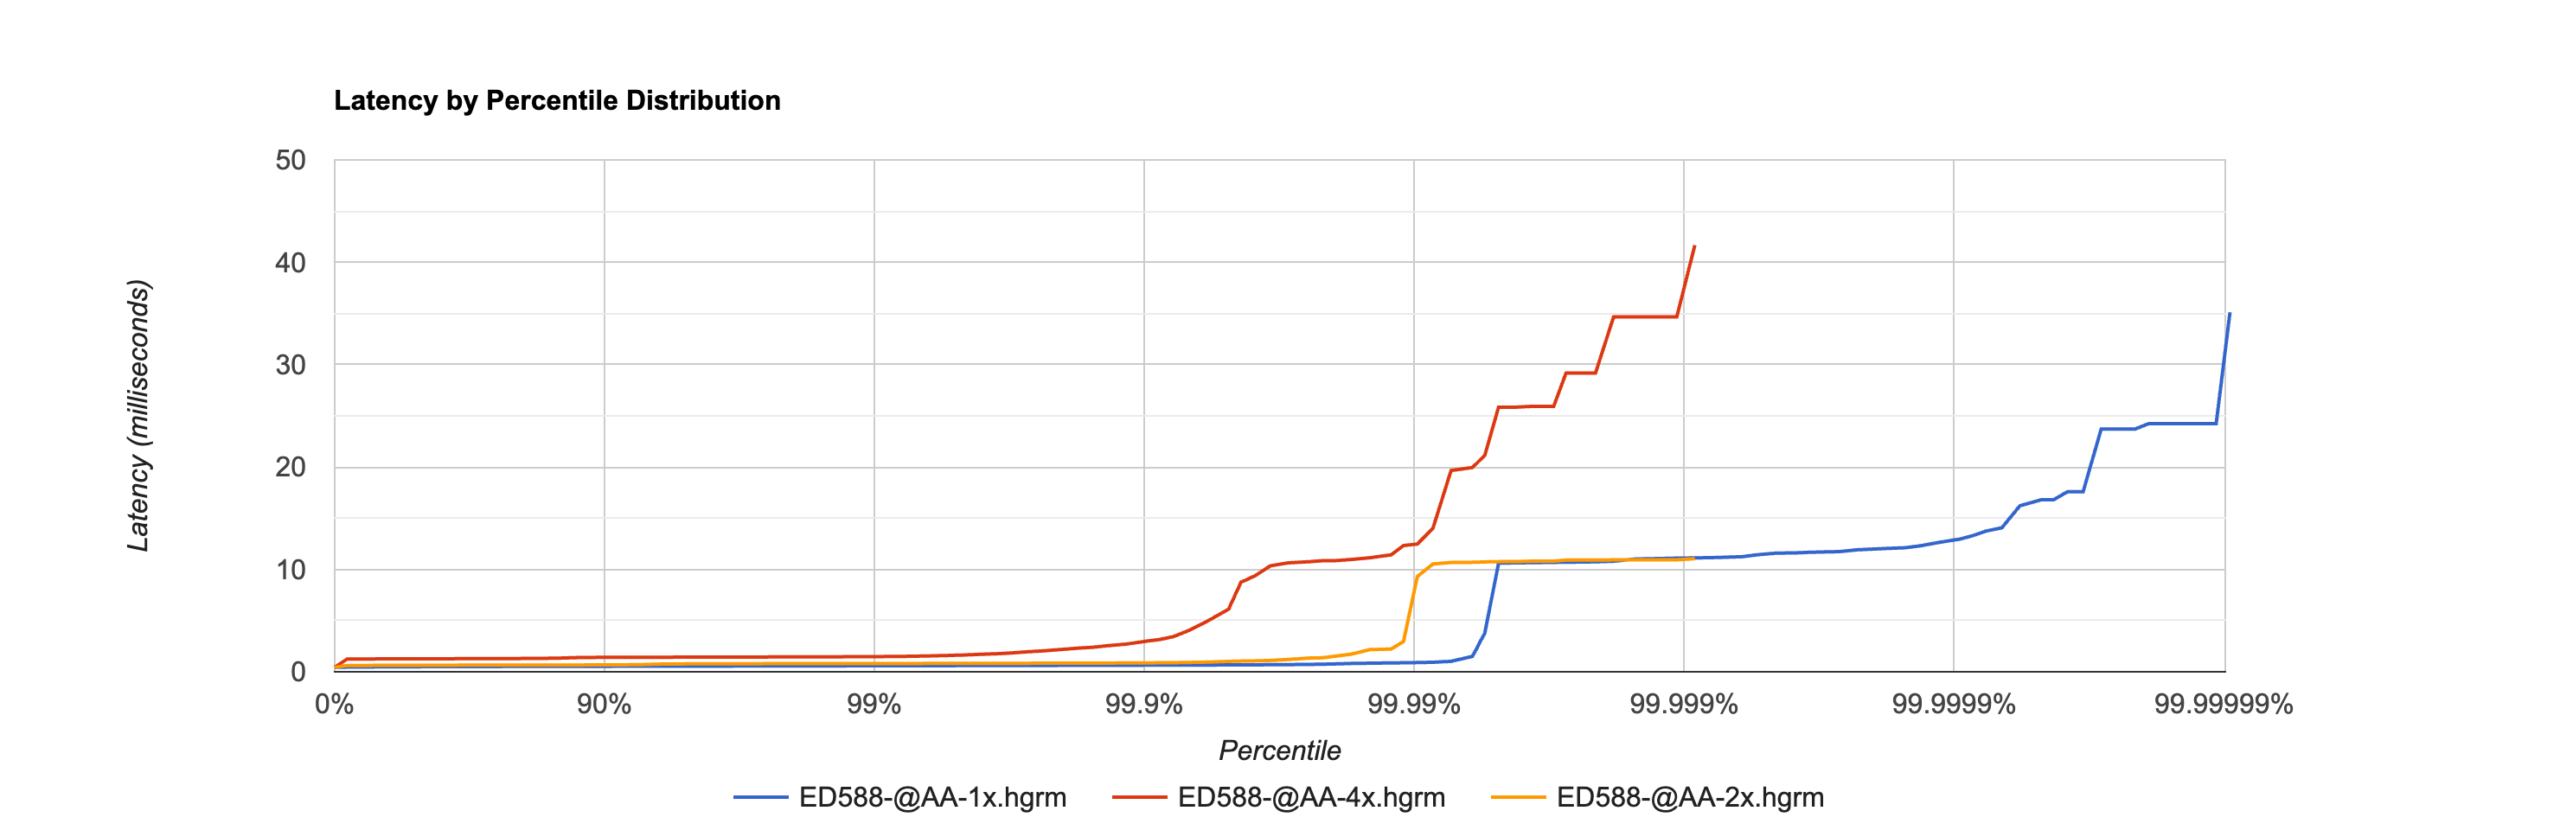
The graph tells the story visually: the line stays flat well past 99.99% before tail latency finally appears. The further right that line stays flat, the more “nines” of consistent performance you get.
Industrial IO Latency Comparison
| System Type | Typical Response Time | Notes |
|---|---|---|
| Brainboxes ED-588 (direct Ethernet) | 0.5 ms median, <1 ms at 99th %ile | ASCII protocol over direct Ethernet cable |
| PLC local IO backplane | 0.01 – 0.1 ms | Fastest option, but requires physical co-location |
| Modbus TCP over managed network | 2 – 10 ms | Standard industrial Ethernet with managed switches |
| Modbus RTU (serial RS-485) | 5 – 50 ms | Depends on baud rate and bus utilisation |
| Wi-Fi or wireless IO | 10 – 100+ ms | Highly variable, not suitable for fast control loops |
| Cloud/MQTT-based IO | 50 – 500+ ms | Round trip through internet infrastructure |
Brainboxes Ethernet IO approaches dedicated fieldbus speeds while keeping the flexibility and cost advantage of standard TCP/IP.
Full Technical Analysis
The full methodology, raw HDR Histogram output, and benchmark source code are available here: Latency & Response Time: Sub-Millisecond IO over 10 Million Requests
Latency
docs.brainboxes.comThe test code is open source. Try it on your own devices: Brainboxes.IO .NET API on GitHub.
We’ll be publishing HDR Histogram results for all IO devices across both ASCII and Modbus TCP protocols. Watch this space.