FAQs
1. Using the BB-400 Serial Port in Node-RED
The only nodes required for this tutorial are:
| Image | Description |
|---|---|
| The serial nodes are used for establishing a serial connection with a COM port on the device. 3 serial nodes will be available (input, output and request). | |
| Inject, for specifying what type of message and the message itself for injecting. | |
| Debug, for debugging the returned data from the nodes it’s attached to. |
You must first make sure you have the correct nodes installed with your Node-RED package.
In this tutorial, you will use the ‘node-red-node-serialport’ package, as well as some examples from ‘node-red-dashboard’ and ‘node-red-node-random’.
1.1. Reading from the Serial Port
With a clean sheet, we’ll start by setting up how to read from a BB-400 serial port. First make sure you’re on your workspace, by going to the link http://{your-ip-address}:1880, or accessing it via the ‘apps’ page from your WebAdmin interface.
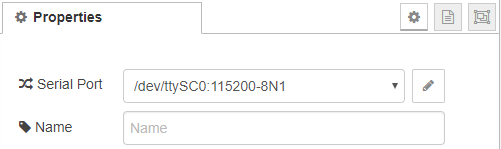
We first need to create a Serial Port connection, a starting point for us to read any incoming data:
 |
|---|
You will need to ![]() . Click on the
. Click on the ![]() button and copy the settings below:
button and copy the settings below:
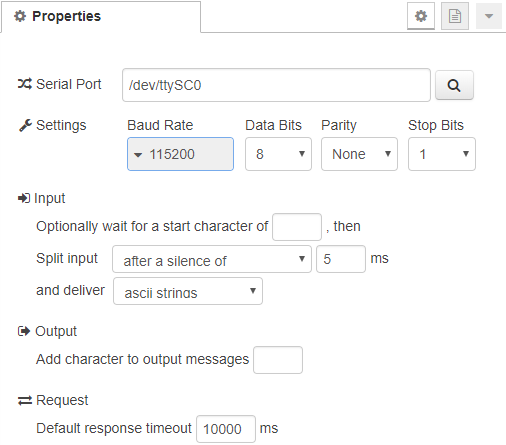
The /dev/ttySC0 is for the physical serial port on a BB-400.
There are also other options for splitting data such as, using a specific character, setting a fixed length or applying a timeout.
You can also change the serial port parameters if you wish (baud rate, data bits, parity and stop bits).
After adding the Serial Read node, we need something to return all the data to. Add a debug node, and connect the right side of your Serial node to it:
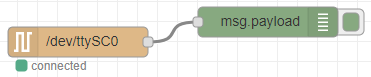
You will not be required to change anything inside the debug node. All of your debug information will appear on the right sidebar under the debug tab ![]() You have finished your very basic and first step to reading the BB-400 serial port. Your data will appear in the bottom right of Node-RED (in the debug messages tab).
You have finished your very basic and first step to reading the BB-400 serial port. Your data will appear in the bottom right of Node-RED (in the debug messages tab).
You can test that it is working, by connecting something to your BB-400 serial port, and sending data to it over serial.
1.2. Writing to the Serial Port
For writing to the Serial Port, you will need to use the output serial port node, instead of the input we used from the previous step.
When you create one, you won’t actually need to configure much about it, as you will just need to select the same serial port in which you created from the previous step:
 |
|---|
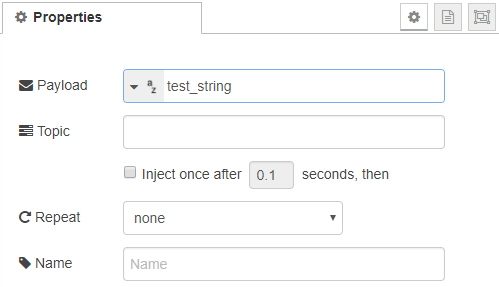
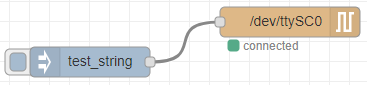
After adding the Serial node, we need something to trigger to send data to that port. Add an inject node to your flow, and attach it to the left side of your output serial node:
 |
|---|
Here I have changed the inject payload to a string, and written ‘test_string’:
You can now deploy your new flow, and start injecting the test_string to your serial port to check that it’s working properly!:
At this point, now that you have a read and write, you can create or attach a loopback connector to your serial port. To create it yourself, you just simply short together pins 2 & 4, and then 3 & 5!
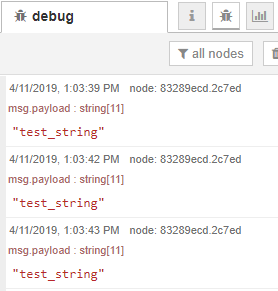
When you click inject, you should see that the read data inside your Debug tab should show the ‘test_string’ data being sent through the serial port!:
2. Using the Node-RED Dashboard
An example application would be that you’re using serial weighing scales, and you’d like to show the information gained into some gauge or chart. Keeping the examples we have from the above steps, we will change the inject, so that it sends random data every one second, and then add both a gauge and chart to visually show that information.
You must use an RS-232 loopback for this example
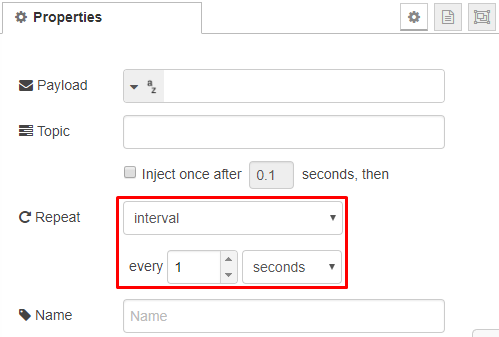
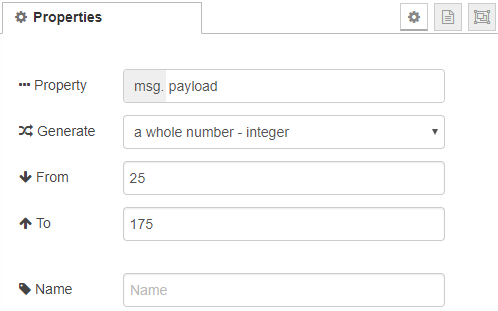
Start by changing the inject to use the following settings:
 |
|---|
Now add a random node, change the data to two random numbers of your choice, and add it in between the inject & serial node. What this will do is simulate the information for us:
 |
|---|
![]()
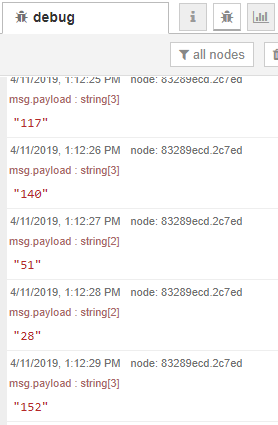
After deploying this new setup, you should begin to see some random data being generated, and looped back into your serial port:
2.1. Visualize your data
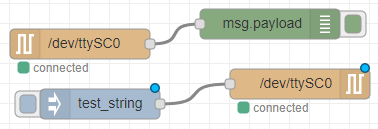
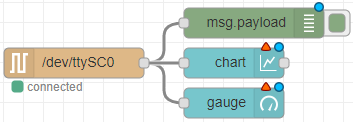
Simply add a chart node and a gauge node, and attach them to the serial input node, where you have your debug attached:
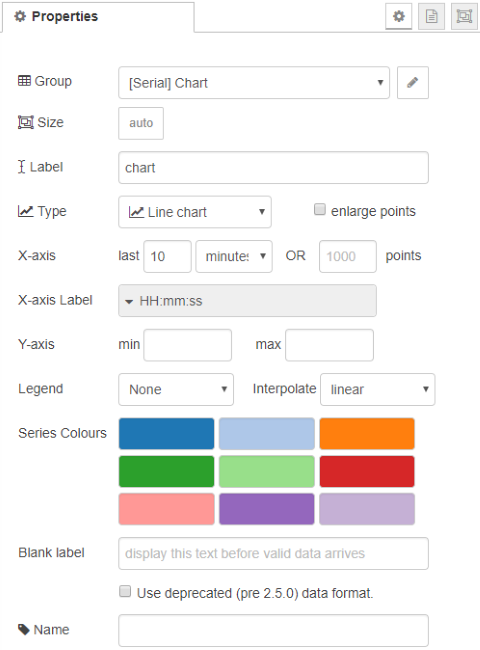
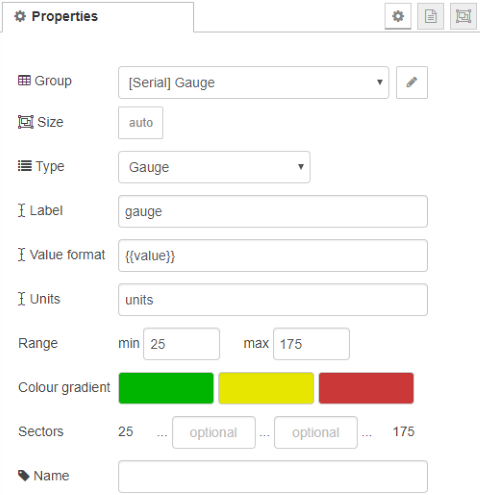
You will need to open up Chart & Gauge, and make sure to add and configure a new Group & Tab to add this information to! In this example, I created 2 tabs; one for the chart, and one for the gauge:
 |
|
|---|---|
 |
You have now completed this basic Node-RED serial port guide!
To actually view the Node-RED dashboard, click the dashboard button ![]() in the top right, then click the pop out button located under it
in the top right, then click the pop out button located under it ![]() .
.
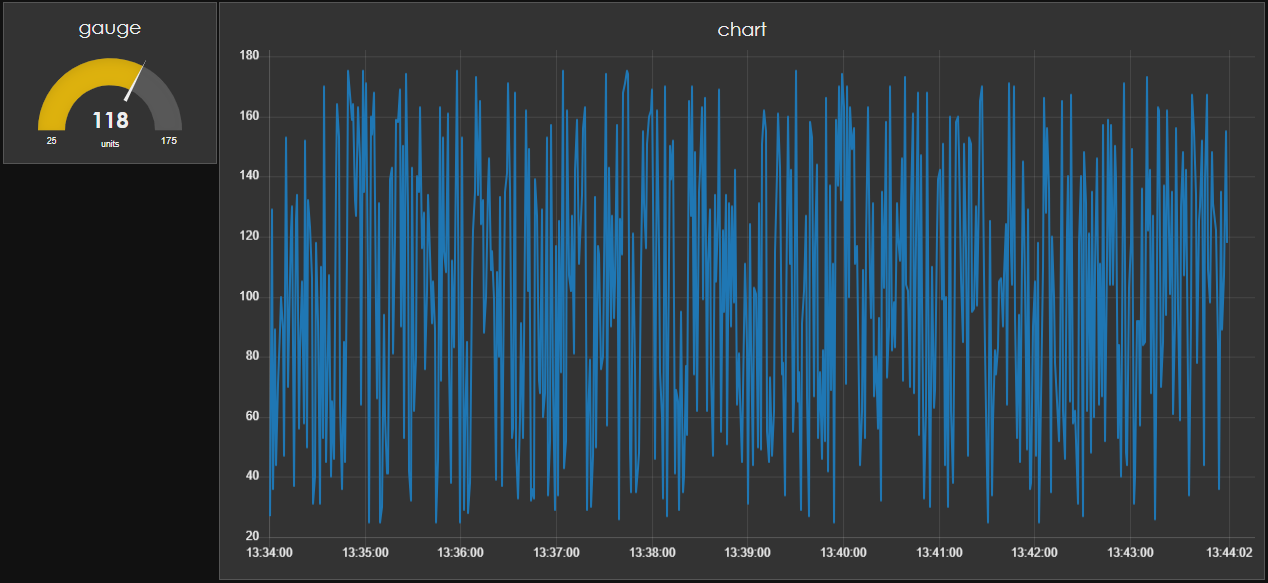
Your dashboard will now open, and show you your chart and gauge, displaying the information currently being sent and received on the serial port!:
Related FAQs
- BB-400 Networking Page
- How do I configure the BB-400’s Serial Port Jumpers?
- How do I find my BB-400 on the network?
- How do I log in to the web Administration interface of the BB-400
- How do I send serial data from the BB-400 to the cloud?
- How do I use Node-RED on the BB-400?
- How to open, send data, and close serial Port on BB-400
- Setting up NodeRED on a BB-400
- Using the BB-400 Serial Port in Node-RED
- What IO Protocols are available on the BB-400
- What networking options are available on the BB-400?
- What Physical Ports are on the BB-400?
Related Products
FAQs