FAQs
Contents
This FAQ will explain how Modbus TCP can be used with Node-RED to control the IO lines. Node-RED can be used on a PC or alternatively you can access a Node-RED instance on your BB-400.
Configuring your Brainboxes Remote IO Device
In this example we will be using a Brainboxes ED-588 which has 8 dedicated input channels and 8 dedicated output channels. However, this guide will work for any ED device.
Before you get started you need to make sure that your ED device is set up correctly, here we are using Modbus TCP to control and read IO lines, so you need to make sure your device is set to the correct protocol.
All Brainboxes devices are shipped from the factory in the ASCII protocol, so this step is important for this example to work.
To do this please navigate to your device’s web configuration page, which can be accessed by entering in your device’s IP address into your web browser. Help on finding the IP address of your Brainboxes device can be found here: How do I connect to a Remote IO device?
Please take note of your IP address as you will need it later on.
Once on the web interface, please navigate to the Protocol Tab which can be found on the left-hand side of the web interface:
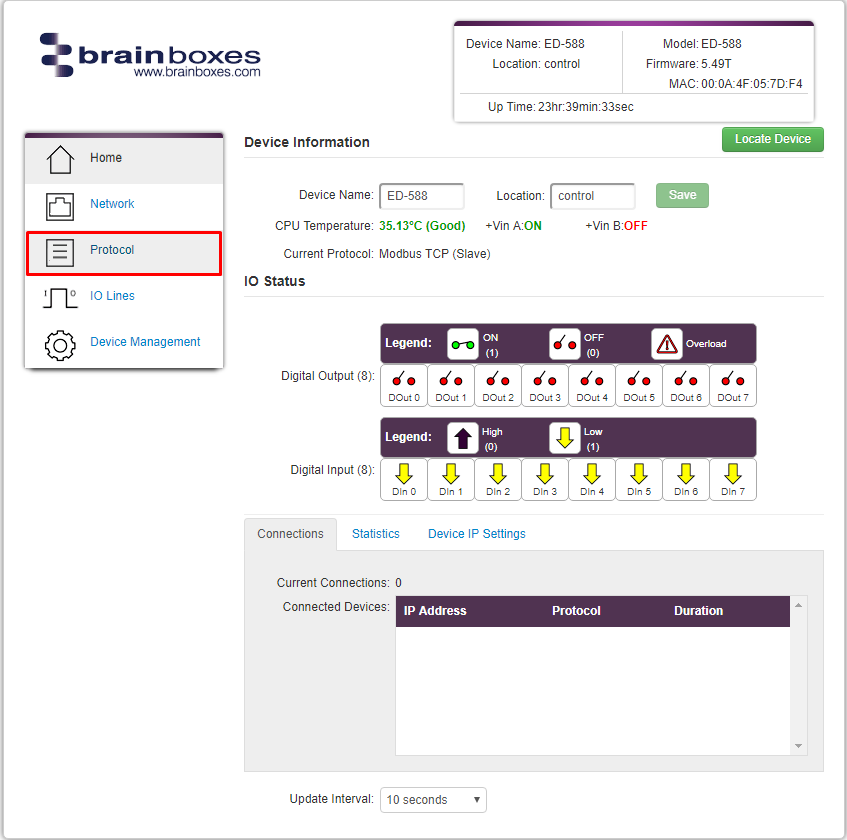
Once in the protocol tab you need to change the Current Protocol to Modbus TCP.
Select the Modbus TCP tab and take note of the TCP port, as you will need it later on, by factory default this should be 502. Click the Save button:
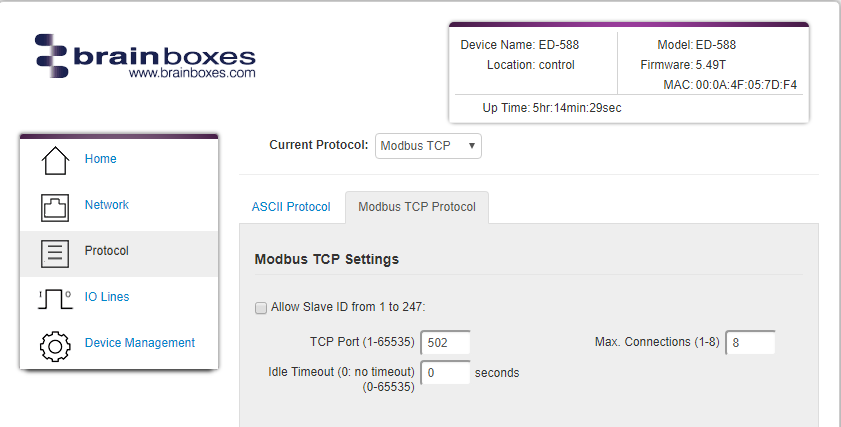
Your Brainboxes ED device is now configured to communicate in Modbus TCP.
Node-RED: Setting outputs
Now that we have successfully configured our ED device to talk Modbus TCP, we can create our flow in Node-RED.
First we will create a way to read and control outputs on the ED. To do this open Node-RED, go to: http://localhost:1880/. We need to configure the Modbus-Write node, this can be found in the Modbus tab of your palette.
To locate the Modbus nodes you can either scroll down the palette or index them by the search bar:
![]()
The purpose of this node is to connect to a Modbus TCP device to write coils/registers at each incoming message. In our case, writing coils simply means setting digital outputs on or off.
Controlling Digital Output 0 from Node-RED
Drag and drop the Modbus-Write node onto the workspace, then double click on the node to open its settings:
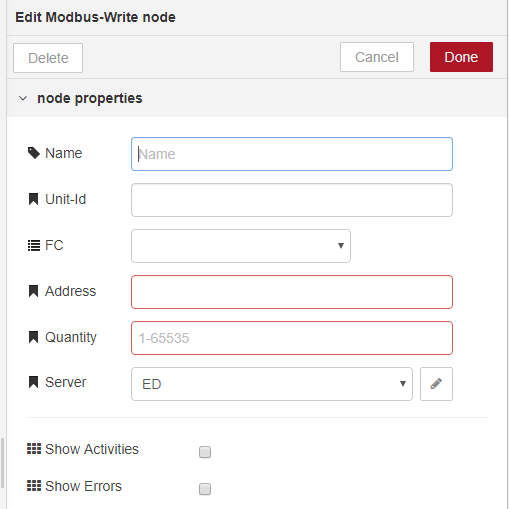
- Give your node an appropriate name, for example Digital Outputs
- Set the unit ID to 255
- Set the FC option to FC 5: Force Single Coil
- Set the address to 0 (as we are addressing output 0)
Then on the server tab, edit it to add your device. Do this by entering:
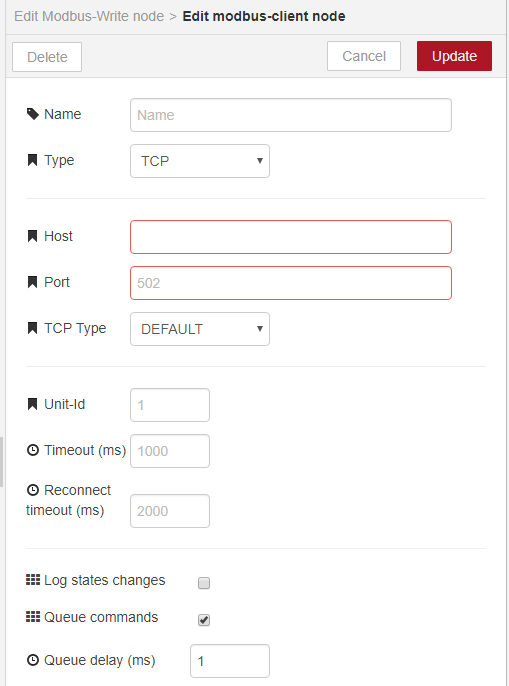
- Name the server: Brainboxes ED
- The Host IP address of your ED device
- The TCP port (you wrote this down earlier)
Set the unit id to 255
Once you have done this, click the deploy button in the top right corner of the screen:
![]()
Selecting this deploys the nodes to the Node-RED server, essentially executing the code.
Once you have selected deploy, please navigate back to your ED device web page where you will see this banner:

Then you know you have successfully created a Modbus TCP connection to your ED device.
We currently have one write node set up and configured to address digital output 0, we now need to create more.
Controlling All Digital Outputs from Node-RED
We can use the same settings as above to create our following 7 Modbus-write nodes, however for each node you will need to change the address by increments of 1.
The first write node we created used address 0, meaning that it is addressing digital output 0. So therefore address 1 will be used to address digital output 1 and so on:
To save time you can CTRL+C and CTRL+V the first node we set up:
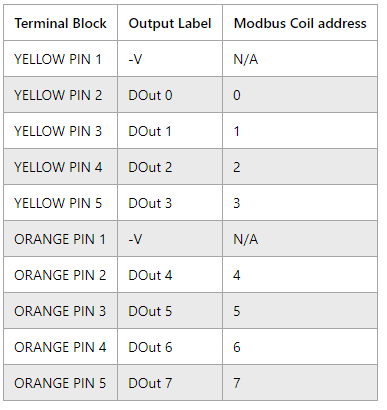
Once we have successfully set up 8 write nodes, addressed to 8 separate digital outputs we need a node to generate a msg.payload with specified On and Off values to alter the state of these digital outputs. In Node-RED msg are messages which are passed between nodes containing any data we choose. In this case we will use a property of msg called payload and we will set payload to be the new value that we want a Digital Output to become.
This is where the Node-RED dashboard package we installed earlier comes into use, in your palette, under Dashboard look for a node called ui_switch it should look like this:
![]()
Drag and drop this node onto the flow, double click on the ui switch node to open its settings:
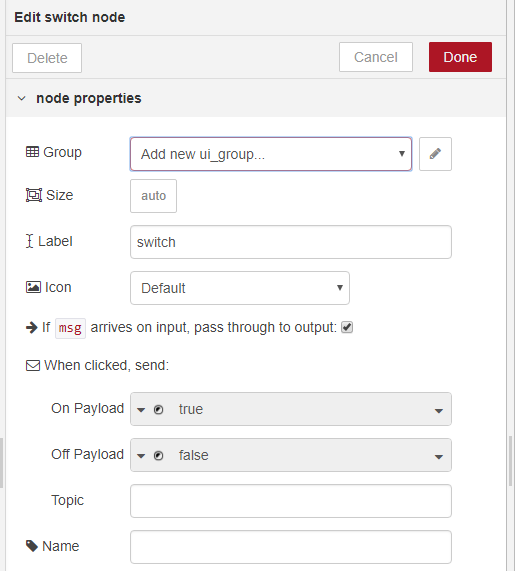
- Give the switch an appropriate label, in this example I’ve named it DOut 0
- Select if msg arrives on input, pass through to output
- Make sure On Payload is set to true and Off Payload is set to false
Then attach this ui_switch to your DOut 0 write node:

Then we need to do the same for the other 7 digital outputs, again note that you are able to CTRL C and CTRL V to save time:
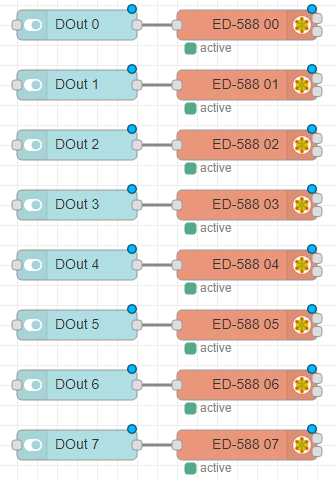
As we have used the ui_switch which is a dashboard node, we are able to view and toggle these switches inside of the Node-RED dashboard webpage.
Toggling these switches to an ON state will CLOSE our digital outputs and toggling the switch to an OFF state will OPEN our digital outputs. If you have an output connected to your ED device you will be able to see its state change (e.g. an LED go from off to on).
Node-RED dashboard
Navigate to the dashboard sidebar which can be accessed from the right-hand corner of Node-RED:
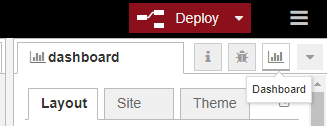
The sidebar of Node-RED will show the dashboard tab which contains the names of the ui-switches:
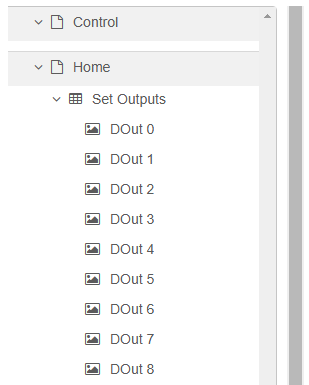
You are able to drag and drop these boxes to set the order of the switches. You can now simply select ![]() then navigate to your dashboard page.
then navigate to your dashboard page.
To view the dashboard:
- type http://localhost:1880/ui into your web browser or
- click the open web page button at the top of the dashboard tab:
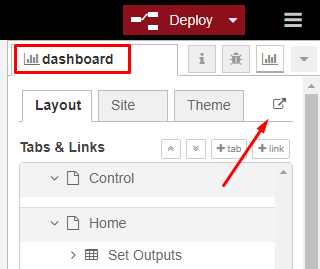
You should now see the following:
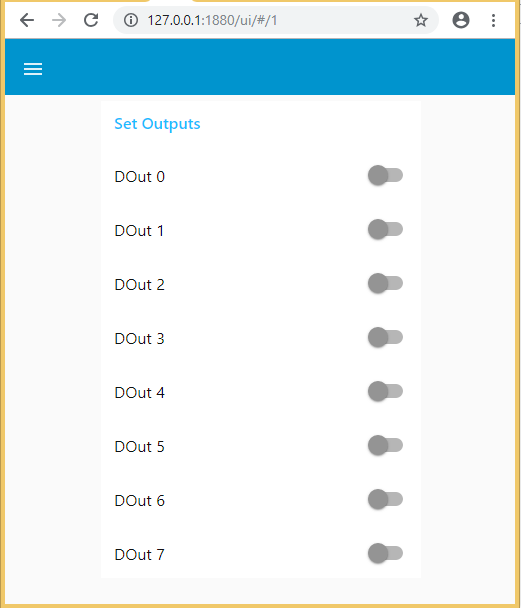
You can toggle these switches on or off to alter the state of the digital outputs. A quick test of this would be to toggle some of the switches whilst viewing the web server page of your ED device:
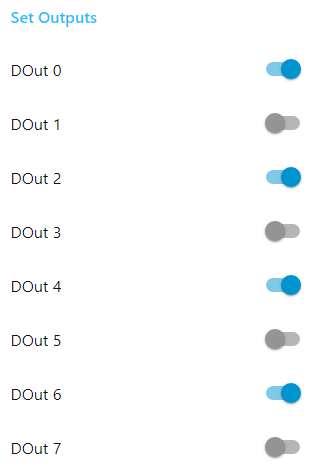
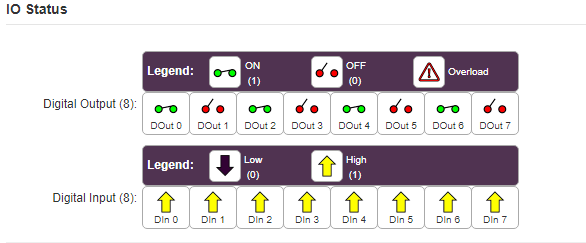
You have now successfully altered the state of your digital outputs with the use of Modbus TCP and Node-RED.
Node-RED: Reading inputs from Brainboxes ED
Now that we have successfully altered the state of our digital outputs, we can improve our Node-RED flow by reading inputs.
The first node we need to configure is the Modbus-read node, this can be found in the Modbus tab of your palette:
![]()
The purpose of this node is to connect to a Modbus TCP device to read registers/coils values with a given polling rate. In our case the registers are the ED device’s digital inputs.
Drag and drop this node onto the flow, double click on the Modbus-read node to open its settings:
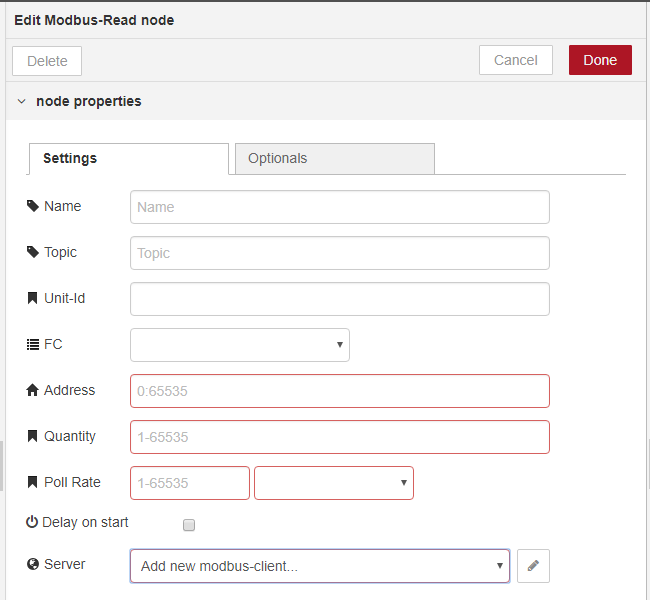
- Give it an appropriate name, in this example I’ve simply used ED-588 Inputs
- Change the FC value to FC:4 read input registers
- Set the address to 0
- Set the quantity to 8 as there are 8 digital inputs
- Change the poll rate to something suitable for the application, 250ms means the node application will feel responsive to changes
- Set the server to: Brainboxes ED (configured in the previous example)
Now we have set up a node that is able to detect the changing state of a digital input, and give the count of how many times the input has changed. This could be useful for example, to record how many times an alarm has triggered, a machine has stopped or a light has flashed. We now need a node to display this information.
Check Modbus values
The node we will be using for this is the Modbus-response node, this can be found in the Modbus Section of your Palette:
![]()
The purpose of this node is to display the response of a Modbus Read/Write Node, in our case the response is the input counter increasing as we change the state of a digital input.
Please note that this node is not necessarily required when reading input changes, it is simply used as a way for us to see the counter updating within this flow.
Drag and drop this node onto the flow, double click on the Modbus response node to open its settings:
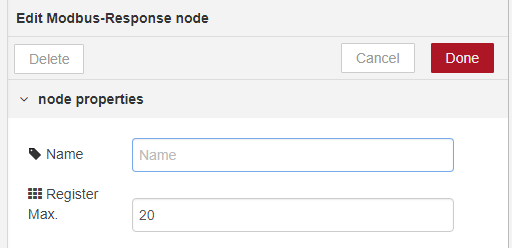
- Give the node an appropriate name: Debug Read Input Counts
- Set the Max Register option to 20
Now connect these two nodes together, and select deploy. If you have set up the nodes correctly then you should see the following:

An array of numbers will appear under your Modbus response node, these numbers represent the count of each digital input. You will notice there are 8 separate values, each one representing a digital input on your ED device, left to right -> DIn 0 – DIn 7.
We can test this is working by changing the state of DIn 0, from high to low low. This can be done by shorting Din0 to GND (or V-).
By doing this DIn0 will go from High to Low and the counter will increase by 1:
Visual Input Counts with Node-RED dashboard
Now we need a way of visualising the data in our Node-RED dashboard, We can do this by using the ui_gauge node that can be found under the dashboard section of your palette:
![]()
The purpose of this node is to add a gauge widget to the user interface, that will allow us to visualise the input lines changing.
Drag and drop this node onto the flow, and double click on the gauge node to open its settings:
- For this example, I’ll be setting the type to donut.
- Set the Label to Input 0, as we’ll be reading DIn0
- Value format should be default
- Units should be set to Input 0
- The range is minimum and maximum input changes the gauge will count – for this example I’ll be using 10
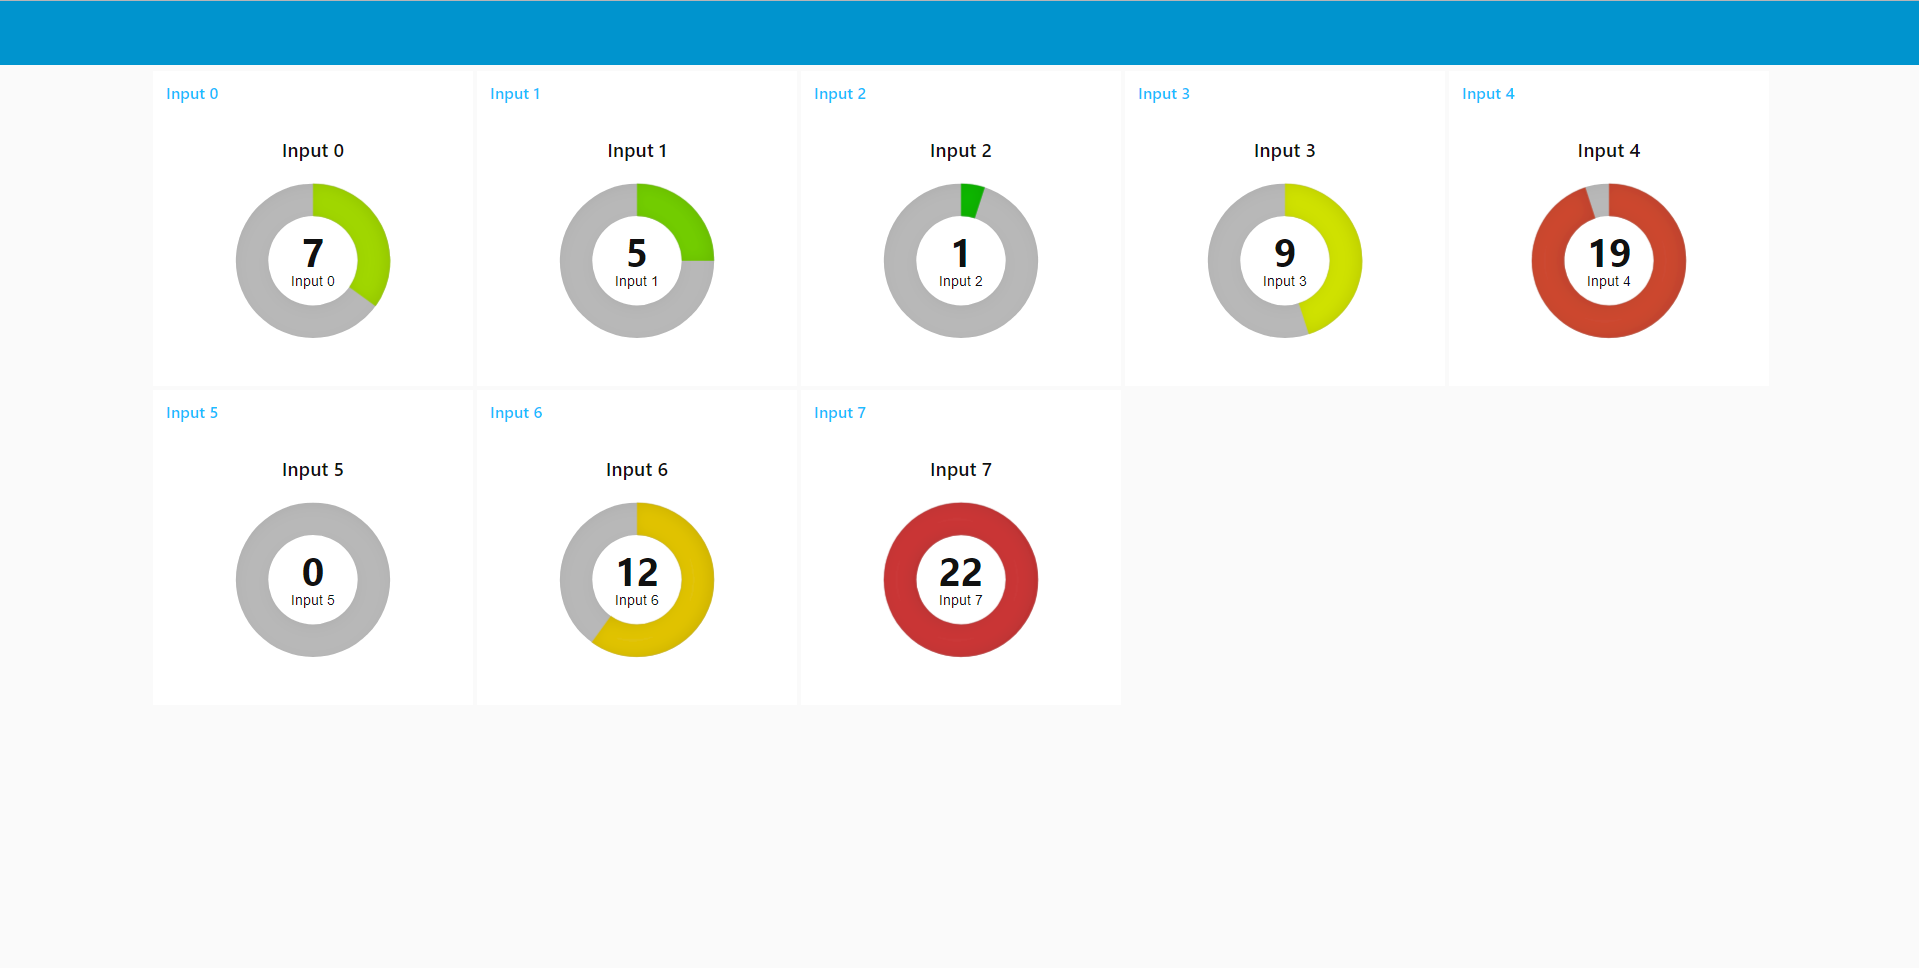
- The colours of the 3 sectors can be specified and the gauge will blend between them depending on the amount of input changes.
For example, if we set the transition to green, orange, and red, and the max range to 10, then that means:
- 0-3 changes would be green
- 4-6 changes would be orange
- 7-10 changes would be red.
Now that we have setup our DIn0 ui_gauge node setup, we can attach it to our Modbus read node like so:

Use the Same Modbus Read Node for all dashboard gauges
Now we can begin to create more ui_gauge nodes for the additional 7 digital inputs:
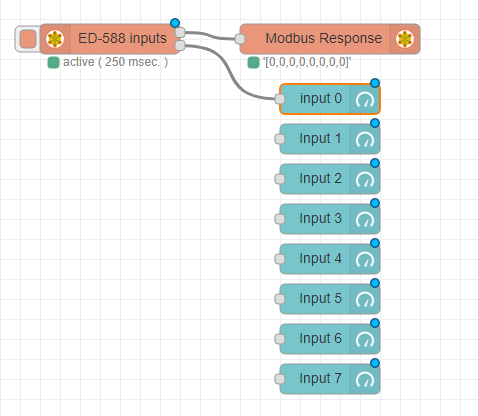
You’ll notice we only have one Modbus read node and both outputs are being used by other nodes, so how do we go about connecting the rest of our input gauges? You could make 7 more Modbus read nodes, however best practice is to have as few Modbus connections to a device as possible, this would be time consuming.
Instead we can use something called a function node, which is a default node in Node-REDs palette:
![]()
The purpose of this node is to allow us to send the incoming msg.payload from our Modbus read node, and mirror it on 8 outputs.
Drag and drop this node onto the flow, double click on the function node to open its settings:
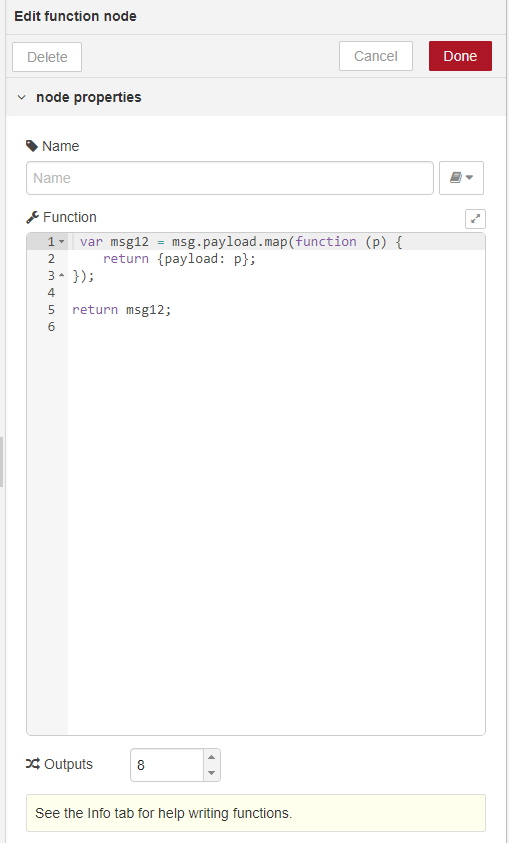
- Give the node a name: Input Function
- Copy and paste the code below into the function block:
return msg.payload.map(function(p) {
    return {payload: p};
});
- Set the output to 8, as we have 8 digital inputs that need displaying on the dashboard
Now that we have successfully setup the Function node, we can connect our input gauges to our Modbus read node, like so:
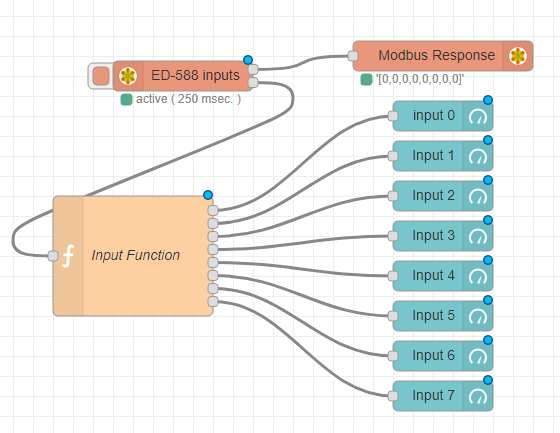
When we deploy our flow, and navigate to the Node-RED dashboard page we will now see the following:
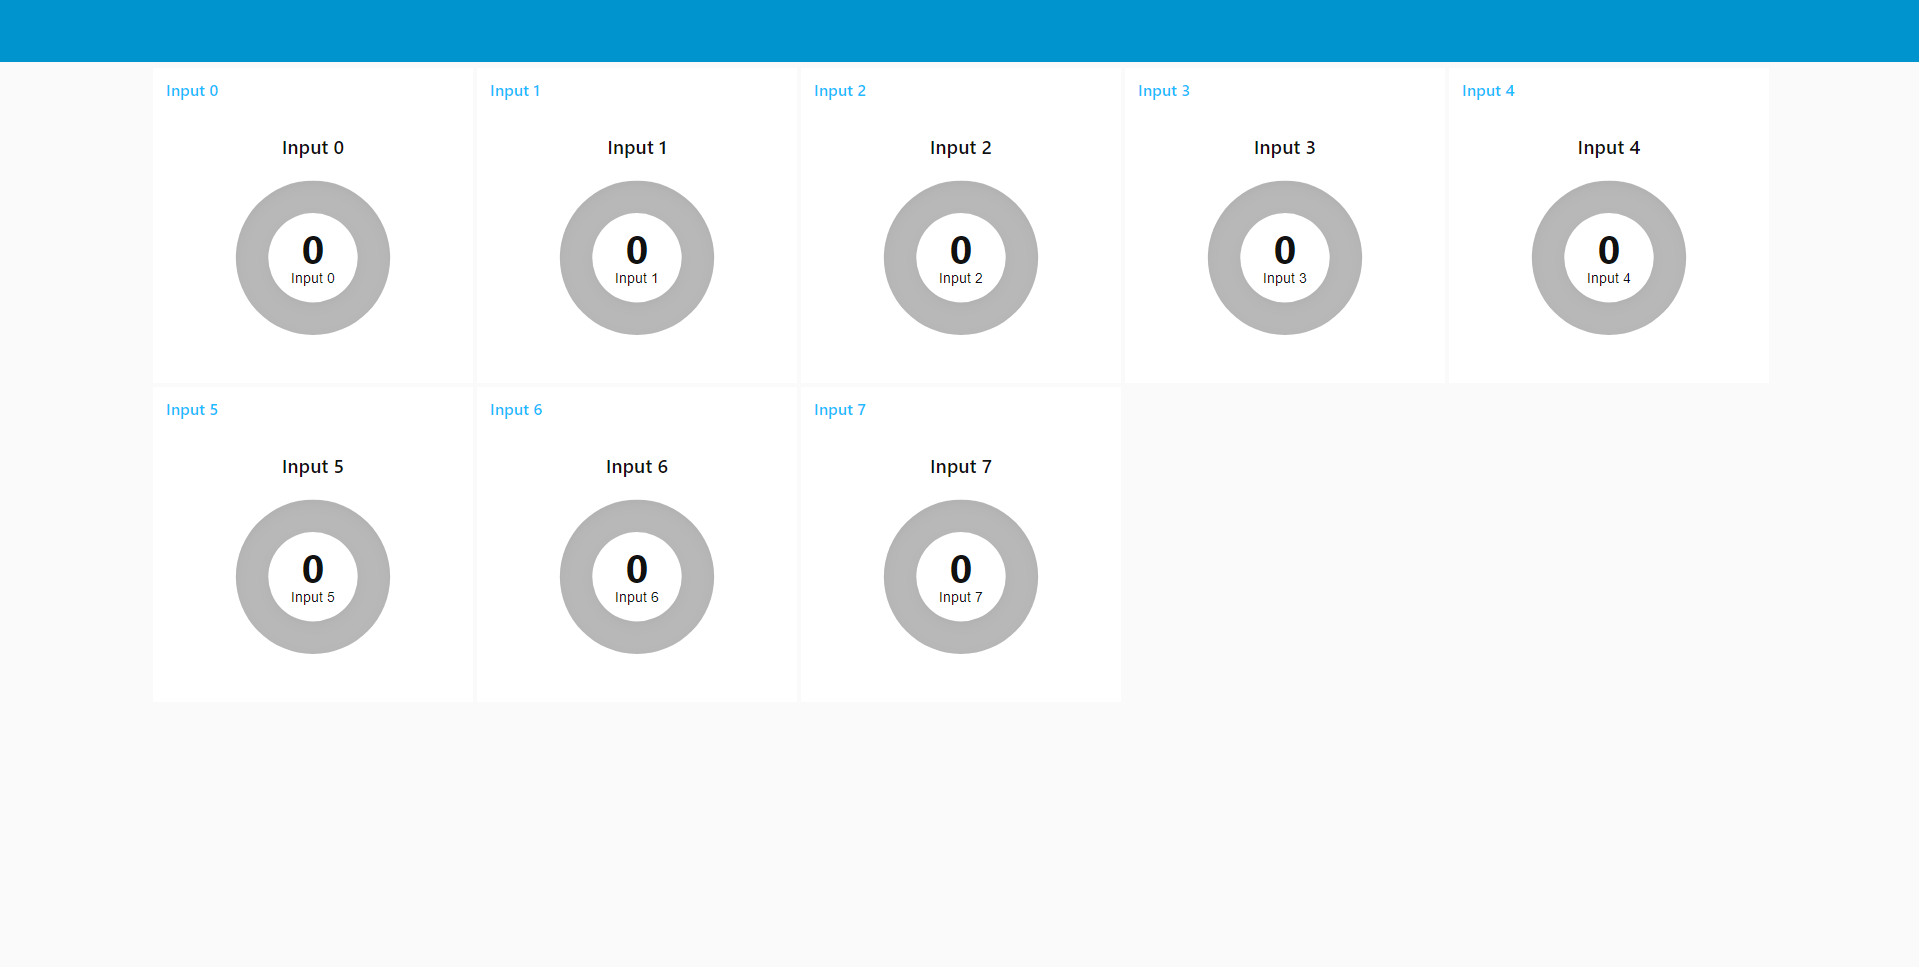
As expected, if we trigger our digital inputs the gauge displays these values:
Further Reading
- Modbus TCP: For more information on coils and commands please see our Modbus TCP manual.

