FAQs
1. Using WebSockets to Control IO
This FAQ will describe how to use WebSockets to control the IO lines using Node-RED.
For more information on Node-RED please refer to the Node-RED FAQ, and for more information on WebSockets there is a Brainboxes FAQ What is the WebSocket Protocol?
The only nodes required for this tutorial are:
| Node | Information |
|---|---|
| Inject, for specifying what type of message and the message itself for executing | |
| WebSocket is used to establish connections to a WebSocket server. It can be configured to ‘connection to’ which is for establishing a static connection, or ‘listen on’ for only listening to responses You will find the WebSocket node in both the INPUT and OUTPUT tabs in the palettes available |
|
| Debug, for returning us any messages inside Node-RED itself. Good for debugging and checking messages are sent/returned |
Before proceeding you will need to make a note of the IP address of your device, and also the WebSocket port. Both of which can be found via the web administration page:
- IP Address: This can be found via the Networking page. For accessing the webpage from another location on the network, you will need to use the IP assigned to the network interface you’re using (Eth0 or Eth1).
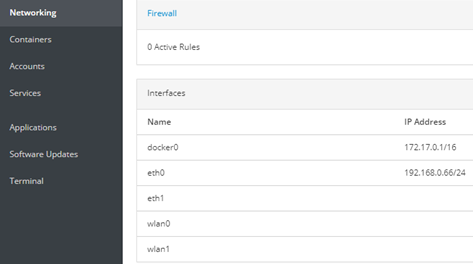
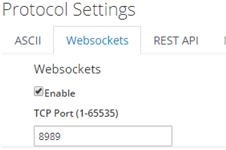
- WebSocket Port: This can be found via the IO page. At the bottom of the IO page, you can configure the protocols you wish to use and change the port numbers.
1.1. Reading the IO status
With a clean sheet, we’ll start by setting up how to read the current IO status. First make sure you’re on your workspace, by going to the link http://localhost:1880.
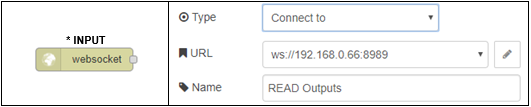
We first need to create a WebSocket connection to the BB-400, a starting point for us to continuously monitor any changes. We only need to pass a WebSocket server connection link, the format of the link is ws://172.17.0.1:8989
- You can use the IP address from your Docker network interface, found on your Networking page on the web administration section. This is equivalent to passing the device localhost.
The WebSocket node can be found in both the inputs and outputs tab in your list of palettes, so please make sure you’re selecting the correct one.
After adding the WebSocket node, we need something to return all the data to. Add a debug node, and connect the right side of your WebSocket node to itP:
![]()
You will not be required to change anything inside the debug node. All of your debug information will appear on the right sidebar under the debug tab ![]() .
.
Your WebSocket connection and reading of the IO Status is now complete. ![]() the project, and click the button beside the inject node to execute the command
the project, and click the button beside the inject node to execute the command ![]() . Your messages will appear in the bottom right of Node-RED (in the debug messages tab) in a JSON format, showing you a 0 or 1 for each input/output line.
. Your messages will appear in the bottom right of Node-RED (in the debug messages tab) in a JSON format, showing you a 0 or 1 for each input/output line.
You can now test that the IO lines are changing by connecting some inputs to the IO lines to use them as inputs in PNP, or even connecting ground to the input when using NPN, and watching the lines toggle. In the next section we’ll talk about toggling some of the output lines. This can be used for testing the toggling and watching the lines switch.
1.2. Toggling the output lines
For toggling the output lines, you will perform steps very similar to reading the output status, in regards to making more WebSocket connections, and instead of an input, we’ll be making it a WebSocket output connection.
First we’ll start by adding 2 inject nodes. One for turning the outputs ON and one for turning the outputs OFF:
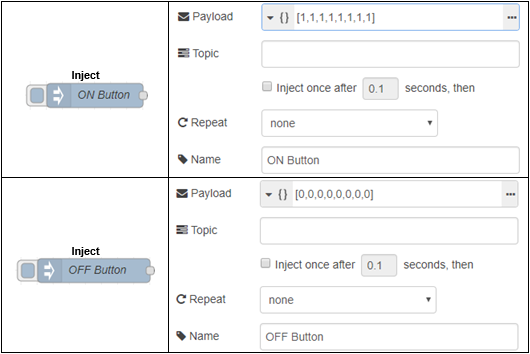
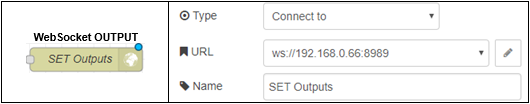
These are the JSON messages we’ll be sending to the WebSocket server on the BB-400, so now we need to create 2 WebSocket nodes to send these messages to. This time, instead of creating an INPUT WebSocket node, we will now create an OUTPUT:
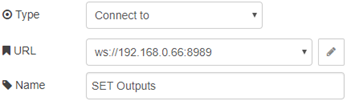
Both of the WebSocket nodes will use exactly the same parameters and URL set up, as this just establishes the WebSocket connection, and the inject node is the one passing it the information. Below is a screenshot of the settings you’ll be using inside your WebSocket node (using your IP address and WebSocket port number):
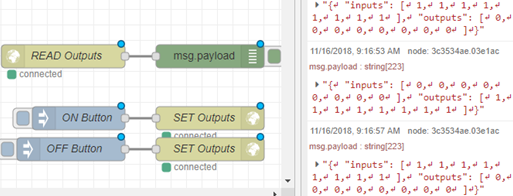
You have now completed this very simple tutorial and learned how to set up Node-RED with the BB-400 IO lines. You can execute the injections by clicking the small button next to them. After doing so, you can check the IO line status via the debug message window on the right:
2. Using the Node-RED Dashboard
After installing your Node-RED dashboard successfully, you will find a new set of palettes available for use which can be found under the tab ‘dashboard’:

It provides a whole range of different UI elements for your Node-RED dashboard. From showing simple information via a text box, putting it all inside a chart or gauge, to using sliders, buttons and switches to execute specific flows you have.
Below you will find three very simple examples of how you can use the Node-RED dashboard for displaying information from or giving information to your BB-400.
2.1. Viewing the Output Status
For this example, we will simply create 2 buttons. One to turn all of the outputs on, and one for turning them all off. We will use the example provided above, and add to it, to make your Node-RED dashboard display the information we’ve given it.
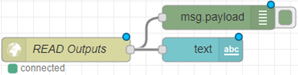
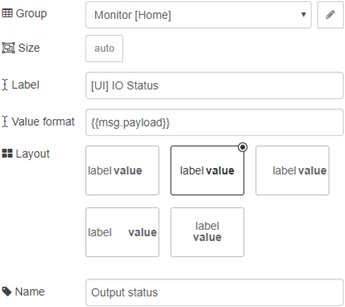
First, drag a text palette out from the left panel onto your workspace, and attach it to your READ Outputs:
It’s actually as simple as that, it’s not a requirement that you change any configuration settings inside the node itself, however below is an example of what can be changed inside:
This is how it displays on the Node-RED dashboard, which you can access via: http://localhost:1880/ui
![]()
Every time you change your UI status, these values will be updated.
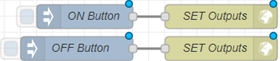
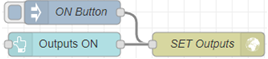
Here we can replace the inject nodes with the button palette instead, and put the same data into the payload. This is also another simple change to what you currently have:
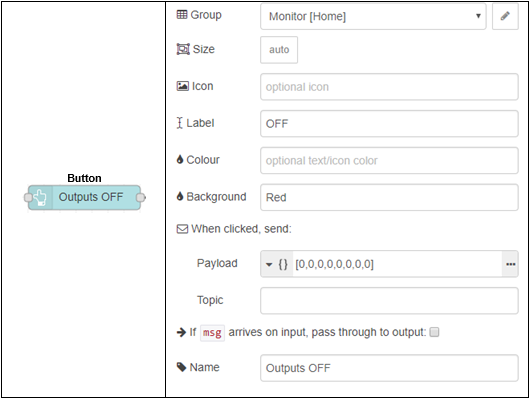
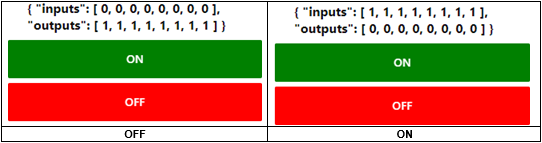
You can add colours, custom icons or even different complex templates. Below is the result of what we have created. If you still have the text box explained from section 6.1, you can test your buttons and watch the IO status change between zeroes and ones:
2.3. Switches for Setting an Output Line
For this last tutorial, you will be setting singular output lines instead of them all. Please note that you can do this for any of the output lines, or even mix/match all of the output lines inside the payload, for example:
[ 0, 1, 0, 1, 0, 1, 0, 1 ] = Only outputs 1, 3, 5, and 7 will be ON.Look inside the ‘dashboard’ section in the palettes for a switch, and start by dragging one onto your workspace:
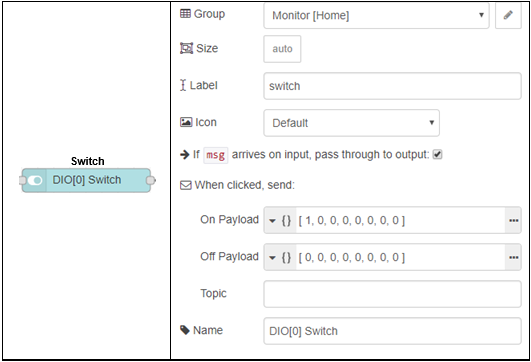
We also need a WebSocket connection, and attach it to the right side of the new switch like the example below:
![]()
Please note in the switch, we are using “[1,0,0,0,0,0,0,0]”. This JSON line is changing DIO0 to be on. If for example we wanted DIO4 to be on, the line would be “[0,0,0,0,1,0,0,0]”.
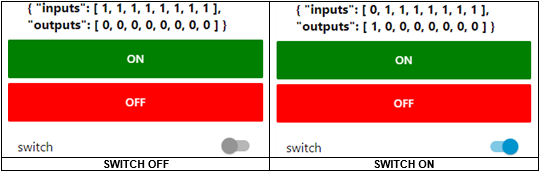
This is how it will look switching DIO0 on the Node-RED dashboard:
FAQs