FAQs
Contents
This FAQ will describe how to use REST to control the IO lines using Node-RED. For more information on Node-RED please refer to the Node-RED FAQ , and for more information on WebSockets there is a Brainboxes FAQ What is the REST Protocol?
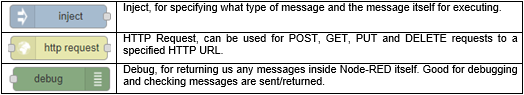
The only nodes required for this tutorial are:
1. Reading the output status
With a clean sheet, we’ll start by setting up how to read the current output status. First make sure you’re on your workspace, by going to the link http://localhost:1880, using your own IP.
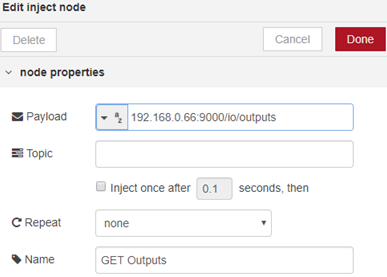
We first need to inject, a starting point for us to execute the sequence. We will specify the message as a simple string of the webpage we’d like to use, which is http://172.17.0.1:9000/io/outputs
First start by adding an inject node, which can be found from the palettes on the left, and place it anywhere on your workspace. If you then double click the inject node, apply the same settings as I have displayed below:
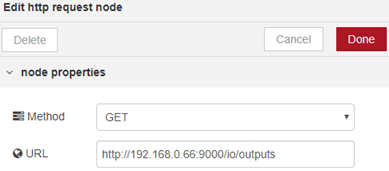
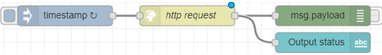
Next, add a HTTP Request node, which will carry out the GET method from the request:
Lastly, we need a debug node which will give us the reply back from the http request. Using the inject to http request will work as it is, but since this is a GET request, you’ll see no message without the debug node.
We can attach the debug node at the end, and leave all the setting inside as default:

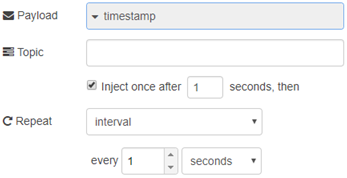
This Node-RED flow can also be changed so that it automatically reads the output lines every x seconds using the same inject palette. Simply change the payload type on the ‘GET Outputs’ inject to a timestamp, and change the repeat option to an interval of x seconds. For the example below, I am using it to poll every 1 second:
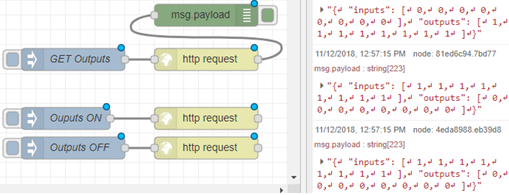
Your GET request is now complete.  the project, and click the button beside the inject node to execute the command
  . Your messages will appear in the bottom right of Node-RED (in the debug messages tab) in JSON, showing you a 0 for open, or 1 for closed for each output line.
1.2. Toggling the output lines
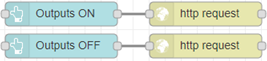
For toggling the output lines, you will perform steps very similar to reading the output status, but with a few different changes. First we’ll start by adding 2 inject nodes. One for turning the outputs ON and one for turning the outputs OFF:
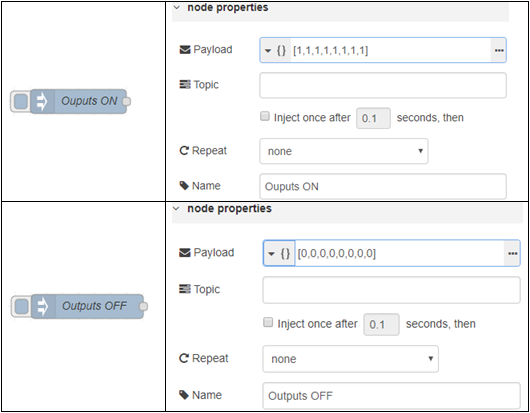
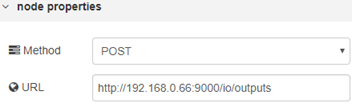
These are the JSON messages we’ll be sending to the REST server on the BB-400, so now we need to create 2 HTTP Request nodes to send these messages to. This time, instead of setting them to a GET request, we will now POST the request.
Both of the HTTP request nodes will have the exact same method and URL set up, as the only thing which will matter, is the injection method we’re sending to it. So set up them both with the following settings:
You have now completed this very simple tutorial to learning how to set up NodeRED with the BB-400 IO lines. You can execute the injections by clicking the small button next to them. After doing so, you can check the IO line status via the debug message window on the right:
2. Using the Node-RED Dashboard
After installing your Node-RED dashboard successfully, you will find a new set of palettes available for use which come under the tab ‘dashboard’:
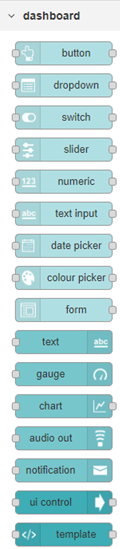
It provides a whole range of different UI elements for your Node-RED dashboard. From showing simple information via a text box, putting it all inside a chart or gauge, to using sliders, buttons and switches to execute specific flows you have.
Below I have provided two very simple examples of how you can use the Node-RED dashboard for displaying information from or giving information to your BB-400.
2.1. Viewing the Output Status
For this example, we will simply create 2 buttons. One to turn all of the outputs on, and one for turning them all off. We will use the example provided above, and add to it to make your Node-RED dashboard display the information we’ve given it.
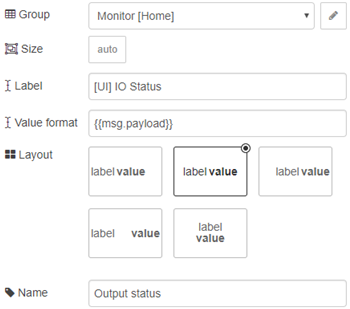
First, drag a text palette out from the left panel onto your workspace, and attach it to your GET Outputs HTTP Request:
It’s actually as simple as that, it’s not a requirement that you change any configuration settings inside the node itself, however this is how I have my text box set up to display the output status:
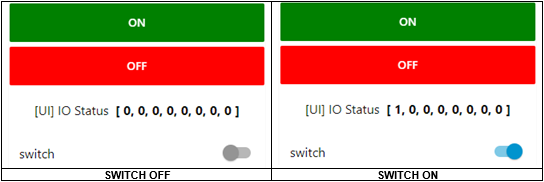
This is how it displays on the Node-RED dashboard, which you can access via http://localhost:1880/UI

Every time you change your UI status, these values will be updated.
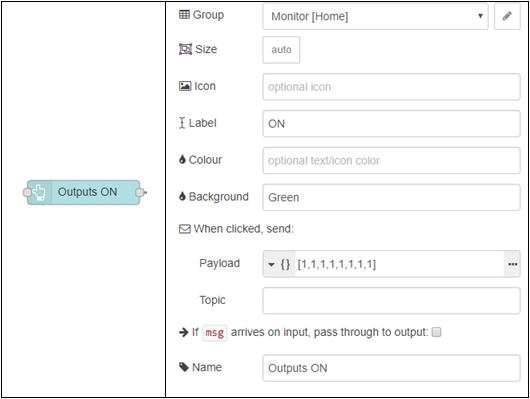
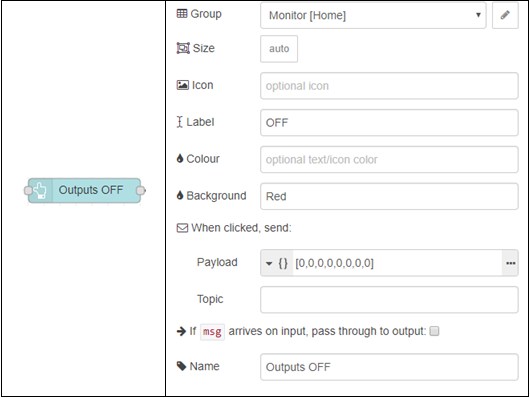
Here we can replace the inject nodes with the button palette instead, and put the same data into the payload. This is also another simple change to what you currently have:
2.3. Switches for Setting an Output Line
For this last tutorial, you will be setting singular output lines instead of them all. Please note that you can do this for any of the output lines, or even mix/match all of the output lines inside the payload, for example:
[ 0, 1, 0, 1, 0, 1, 0, 1 ] = Only outputs 1, 3, 5, and 7 will be ON.Look inside the ‘dashboard’ section in the palettes for a switch, and start by dragging one onto your workspace:
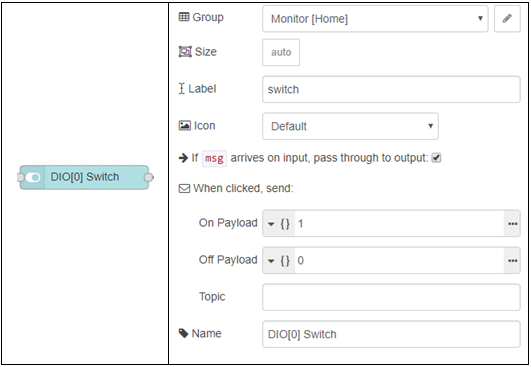
We also need a new HTTP request, and attach it to the right side of the new switch like the example below:

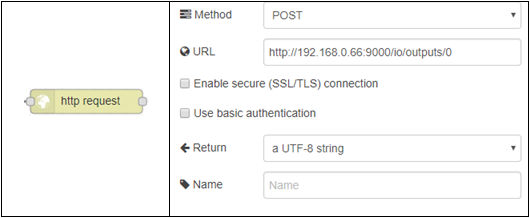
Please note the URL we are using in this HTTP Request. We are specifically choosing to post this request to /outputs/0, which is the first IO line on your BB-400 (TERMINAL GREEN, PORT 2). This is how it will look on the Node-RED dashboard:
FAQs